Cold, Wind and Cattle

Cold temperatures lose there bite when wind speeds are low. Even temperatures down near freezing can feel balmy when the wind is still.

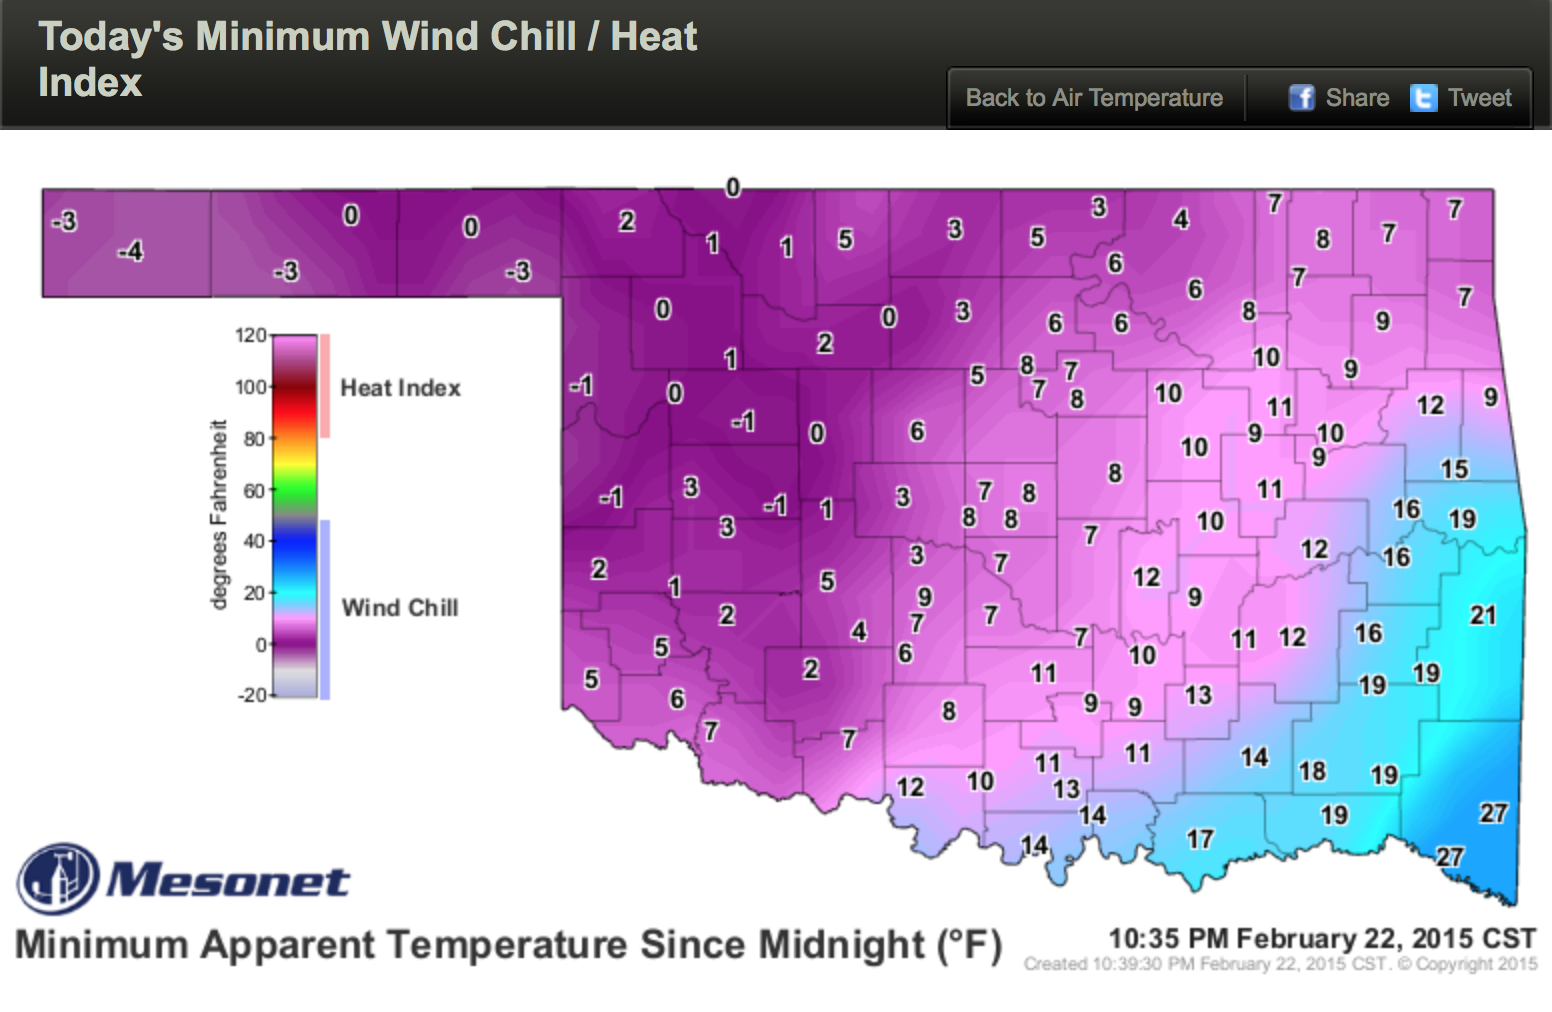
The real chill comes when the wind drives the cold through your clothes. With a biting wind, cold temperatures can chill you clear down to the bone. Consider Sunday, February 22, 2015 across the state of Oklahoma. The coldest wind chills that day were single digit numbers. On the Oklahoma Mesonet, wind chill and heat index are reported on the Apparent Temperture map. This provides a single map that can show either or both heat and cold stress.

2015 02 25.Ag Blog.No 01.Sunday Min Wind Chill

Continue reading

Wheat First Hollow Stem Advisor

In the Great Plains, wheat and cattle go together like beef and potatoes, pancakes and syrup, bread and butter. Wheat is a great winter forage. Cattle love it and its excellent for weight gain.

Farmers and ranchers have a choice to graze wheat and skip grain production or pull cattle in late winter and allow the wheat plant enough time to produce grain. To grow wheat as a dual-purpose crop, make the most of grazing, and still produce a good grain crop, wheat growers pay attention to first hollow stem.

Wheat First Hollow Stem dime

Continue reading

New Cell Phone Forecast Tool from the National Weather Service

You need the weather to hold for two more hours to finish your latest job. Will it? Will it get too windy to spray? Is the temperature going to change rapidly impacting livestock? Is rain headed your way?

The National Weather Service (NWS) has a new EXPERIMENTAL forecast webpage/widget designed for mobile devices that offers an excellent assortment of easy to access forecast and weather information.

2011 02 11.No 01.Ag Blog.NWS Exp Widget

Continue reading

Relative Humidity and Dewpoint

Farmers and ranchers understand what relative humidity means. Humidity and hay moisture are critical for proper baling. The right humidity is needed for cranking up the combines for wheat harvest in summer or the cotton stripper in fall. High humidities and mild temperatures make it ideal for fungi to attack plants. Low humidity increases fire danger.

2015 02 03.No 01.Relative Humidity.Dec 01

So farmers and ranchers have a good feel for humidity. What about dewpoint temperature? Dewpoint temperature is that other “temp” that TV meteorologists have on their graphics. Dewpoint is common to meteorologists. It’s not commonly talked about in ag circles.

Continue reading

Monitoring Crop Heat Units

Fall really brings out the differences in crop heat units. It’s a time that highlights the differences in each days heat units and their accumulation.

Cotton and Peanut Crop

Growers are carefully monitoring cotton and peanuts in Oklahoma to prepare for harvest this fall and early winter. One of the weather-based tools available to farmers are degree-day heat unit calculators. This tool uses daily air temperature minimums and maximums to calculate the heat units crops receive to drive growth. Accumulated degree-day heat units over the growing season provide an estimate of crop maturity.

The Oklahoma Mesonet has Degree-Day Heat Unit Calculators for alfalfa, corn, cotton, grass hay, peanut, sorghum, soybean, and wheat. Users can go back to 2004 to compare heat units from previous years to each other or the current season. Growers can enter their closest Mesonet site and crop planting date to calculate a custom degree-day heat units for their crop.

Continue reading

Are We at Fall Yet?

So when does fall begin? From a farming, ranching, gardening standpoint, it’s when air temperatures drop into mild ranges and water demand tapers off. It’s when plants respond with their fall flush of growth. Animals respond by playing more. Livestock gain more. And the kids quit asking if we’re there yet!

If we just consider minimum air temperature as a season mark, we could turn to a long-term averages graph for our dates. This graph from Minco, in central Oklahoma, has two orange lines that highlight the average dates when the minimum air temperature crosses 60 degrees F. We could use these to mark the beginning of summer and the beginning of fall.

2014 09 09.Minco Air Temp.Long-term graph

[Full site: mesonet.org / weather / past data & files / long-term averages - graphs]

Continue reading

Reporting Rainfall

The offense moves first, seeking to confuse, elude, to cut through the defense. If the defense plans well and plays well, each player is in position to stop the one with the ball. Now the outcome hinges on the basics. All of the planning, practice comes down to executing tackling basics.

Collecting rainfall is basic to monitoring weather. Measuring it accurately is like making that open field tackle. Correct rainfall amounts are valuable data for weather records, for climate records. Done wrong, bad data leads to wrong decisions. Done sloppily, it misleads.

OLYMPUS DIGITAL CAMERA

Continue reading

Rainfall Graph as Risk Management Tool

What value does a graph line represent? How can a graph of weather data be a risk management tool? Will comparing rainfall to good and bad years help you make better crop decisions?

The difference in Mesonet rainfall graph lines between 2012 and 2014 represented more than a 100 million bushel wheat crop loss for Oklahoma’s farmers. With the wheat price close to $6 a bushel as this article was being written, that’s $600 million dollars in lost grain production by Oklahoma wheat farmers between a good year and a bad year.

The graph of cumulative rainfall for Freedom for 2012, green line, and 2014, red line, shows the dramatic difference in spring rainfall between these years. The blue fill area is the 15-year average rainfall. The Oklahoma hard red winter wheat crop in 2012 came in at 155 million bushels. In 2014, it was a disasterous 51 million bushels of wheat.

2014 08 14.Freedom.Rainfall.2014.2012.graph

[Full site: mesonet.org / Weather / Past Data & Files / LongTerm Averages - Graphs / Freedom / Rainfall]

Continue reading