Drought is a slow process. A drying process that can cover large areas. Yet even in dry times over dry regions, there are places that catch that extra bit of rain. Sometimes very localized rain. That’s when detailed rain data gives us more insight into the drought situation for select locations.
The Oklahoma Mesonet rainfall maps combine Mesonet rain gauge data and National Weather Service radar rainfall estimates. The National Weather Service uses the Mesonet rain gauge data to ground-truth and calibrate radar reflectance to actual rainfall rates. The radar rainfall estimates are provided by the National Weather Service’s Arkansas-Red Basin River Forecast Center. The Arkansas-Red Basin River Forecast Center is one of twelve National Weather Service River Forecast Centers that provide river and flood status, forecasts, and warnings.
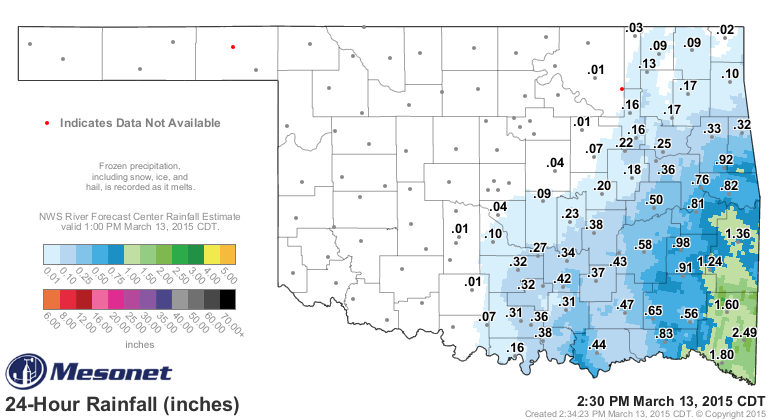
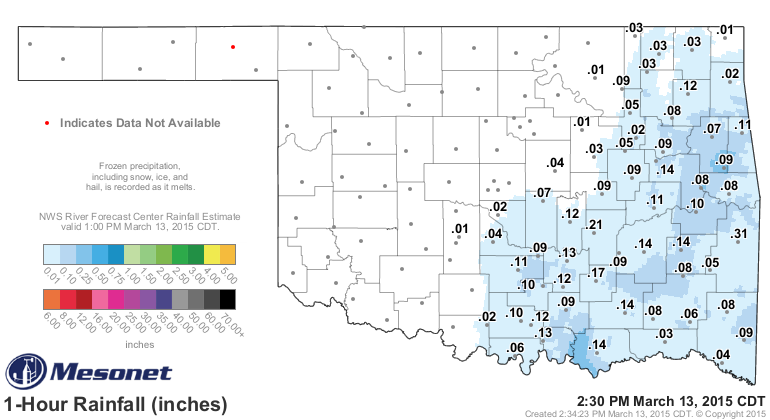
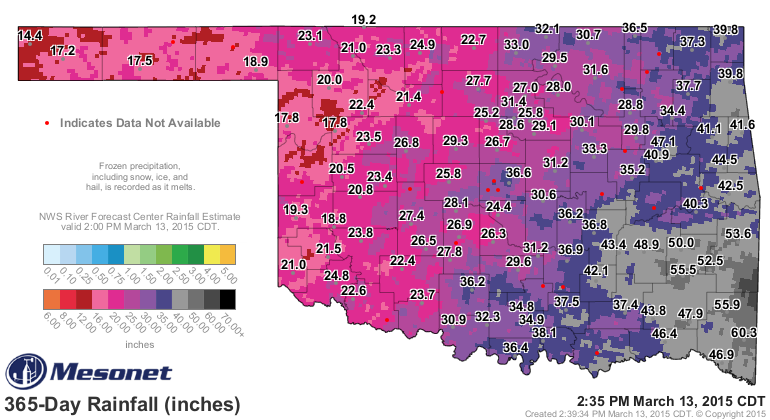
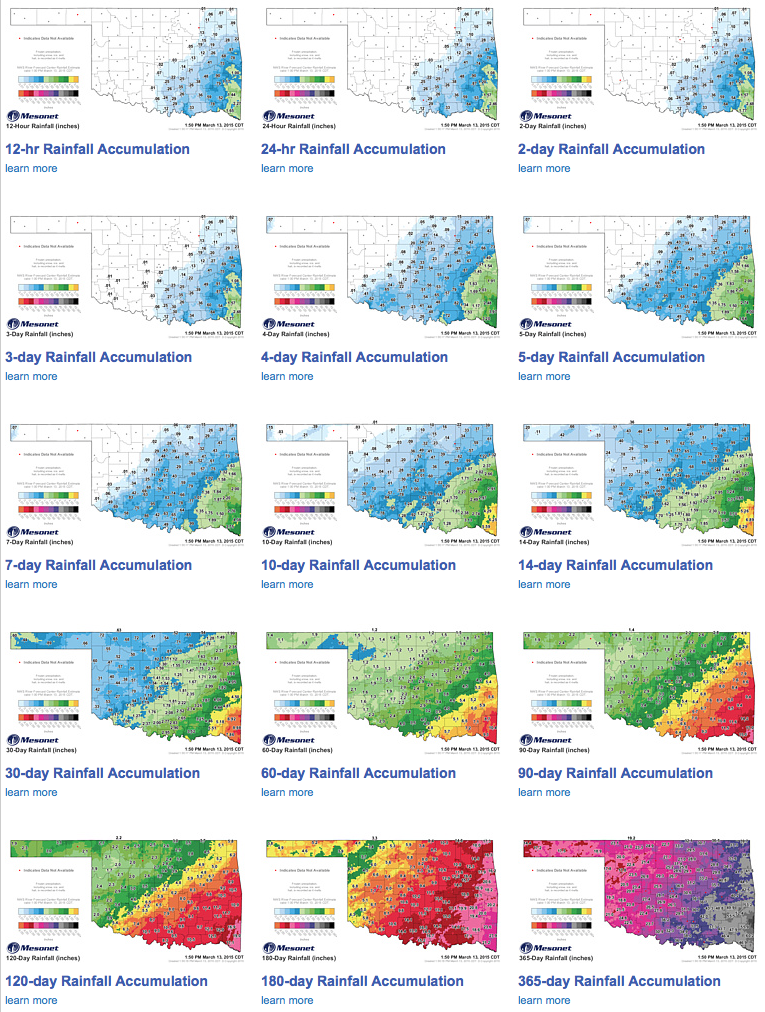
The Mesonet rainfall maps show accumulated rainfall for different time periods, from as short as one hour to as long as 365 days.
The numbers on each map report the amount of rain or frozen precipitation collected in Mesonet rain gauges. The grey dot is the Mesonet tower location. The background colors are the estimated rainfall and frozen precipitation amounts from the Arkansas-Red Basin River Forecast Center.
The radar estimates provide a more accurate estimate of rain that falls between the rain gauges. This really helps in times of drought to identify locations where localized rain events produce higher rainfall amounts or areas that come up short. The legend colors cover a range of rainfall amounts from the lowest at the colors beginning to the highest at the color’s end.
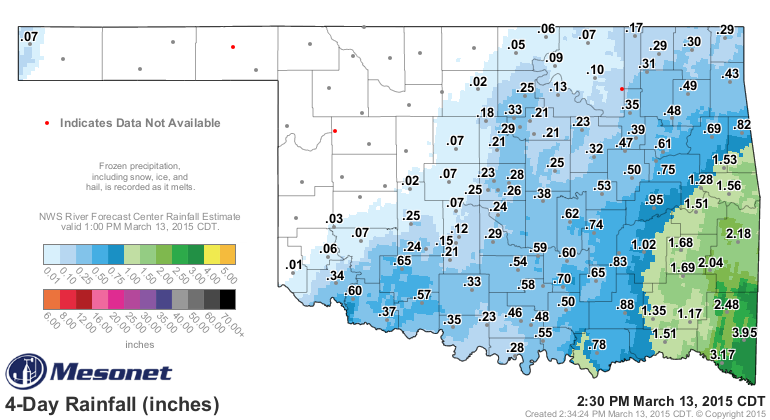
The white areas on the 4-Day Rainfall map below received no rain. The light blue areas had light amounts of less than a tenth of an inch. Down in the far south between Durant with 0.78 hundredths and Madill with 0.55 hundredths of an inch is a light green band that recieved over an inch of rain. We would have missed this band of higher rainfall, without the radar rainfall estimate.
On the 30-Day Rainfall map below, note the variation in the shades of green. The lightest green represents areas that recieved between an inch to one and a half inches of rain. The darkest green indicates those locations that had between 3 inches and 4 inches of rain. In some areas, there is a lot of color change over short distances.
In McCurtain County, in the far southeast, a number of small areas are colored red, indicating rainfall of over 8 inches. South of Durant there is a small yellow area with more than four inches. Farther west, along the Red River, are blue areas surrounded by green. Those blues areas missed the higher amounts of rain or snow.

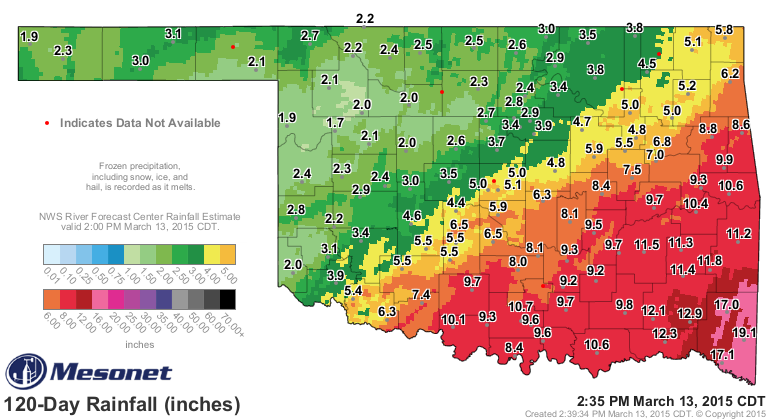
Being able to chose from different time periods, let’s us get a feel for seasonal precipitation. This 120-Day Rainfall map catches precipitation from 2:30 PM November 12, 2014, to 2:35 PM March 13th. It ranges from a low of 1.7 inches at Camargo to a high of 19.1 inches at Broken Bow. What a difference for farmers and ranchers between these two locations!
Mesonet Rainfall Maps are updated every 5 minutes. Their thumbnails are also updated, so what you see on the webpage is a smaller version of the map you’ll access by clicking on the map thumbnail. Tables and maps at the top of the page are rainfall summary products.
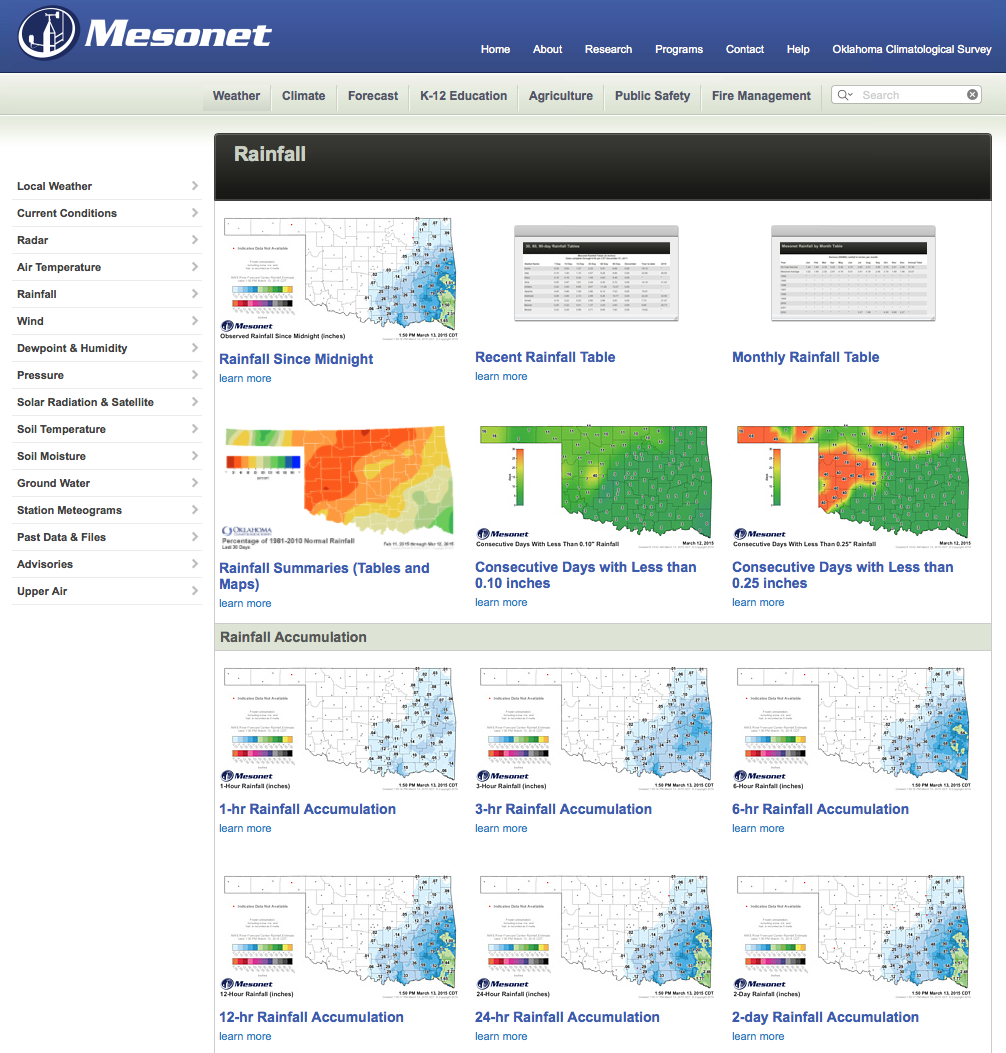
Scroll down the Rainfall section page to see more rainfall maps. You can see how the constantly updated thumbnails lets you quickly get an overview of rainfall over time.
Hopefully, you’ll soon see brighter colors, higher rainfall rates, cover where you live to push you past our current drought and on to times with great growing conditions.
Even though certain regions may be experiencing drought,some parts within the drought affected area receives slight rainfall.Thanks for such a wonderful blog.