Frigid Oklahoma Cattle Comfort

What a cold weekend we just went through! For Oklahoma, the cold air swept through the state on Saturday, December 17, 2016. The next two mornings, Sunday and Monday, were especially brutal for cattle.

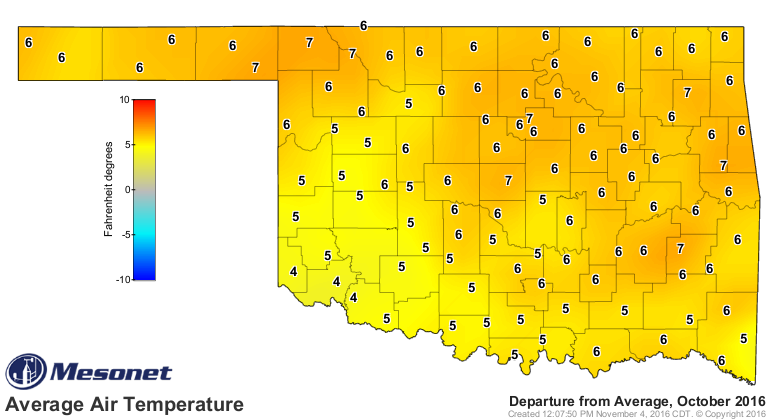
Checking the Mesonet Cattle Comfort Advisor for Saturday, the maximum Cattle Comfort Index values ran from 82 degrees at Broken Bow in the southeast to zero at Boise City and Eva in the Panhandle.

2016-12-17.cattlecomfort.warmest
Continue reading

Cattle Comfort Rollercoaster

Oklahoma’s weather roller coaster has opened for business. And on the farm, the cattle are feeling it. Warm, cold, warm, cold and how about a day of drizzle that turned to freezing rain with a biting wind (Thursday, Dec. 15, 2016).

2016-12-17.Cow in snow.face

Temperature weather variability has two sides. One side is the peak-to peak (amplitude) of the variability, how high or low temperatures go. The mornings of December 17th and 18th are going to be bitter cold with extreme lows. Continue reading

October Warm Temps and Lack of Rain

October followed a warm September with above average temperatures. Unfortunately, what was below average in October were our rainfall totals.

Looking back at October, our average air temperatures for the month were 4 to 7 degrees above average. Northern and central sections of the state, the yellow-orange areas, had the largest departure from the Oklahoma Mesonet Long-term 15-year average (2001-2015).

2016-11-04.Oct 2016.Air Temp Avg departure Continue reading

Fog On the Mesonet

Fog can put a real damper on travel and work plans. Fog slows you down and puts you at greater driving risk. On the farm, fog stops spraying, harvest, and planting. Fog is difficult to forecast. High moisture has to come together with low wind speeds over an extended period of time for radiation fog to set in. The Oklahoma Mesonet recorded those conditions on Thursday morning, October 27, 2016 across Central and Northeastern Oklahoma.

Fog and two trucks Continue reading

Working and Playing in the Heat

One of the weather risks that falls through the cracks of concern is heat stress. Maybe that’s because air conditioning is so prevalent in our homes, cars, and businesses. Maybe folks think Oklahoma’s a hot place and we should just tough it out. But heat can be a real risk, especially if you haven’t acclimated to the heat.

2016-06-14.Woman exercise red face
Source: Popsugar.com Health Jenny Sugar, March 17, 2016

When you go outside are you ready for the heat? Do you know how warm it will be? Can you work or play without risk? Do you have an idea as you grow older of how much heat stress you can take? Do you know when young kids should reduce outdoor activities? Do you let an outdoor task dictate how long you will work or do change your work or play time to the heat conditions? Continue reading

Severe Weather Tool – Text Advisories

You’re looking out your front door at another storm cloud. You’ve located it on radar. But do those brighter radar colors indicate torrential rain or falling hail. How big is the hail? Can you hit the road or should you wait? Is there any flooding? NOAA National Weather Service text products can help answer your questions.

2016-04-28.Ag Blog.No 01.Storm cloud and pickup Continue reading

Wind Whipped Fire: 350 Complex

When we have dry, dead grass, low humidity, and strong, gusty winds, it only takes a spark to setoff a disastrous fire. That’s what we had a week ago on Tuesday, April 5th.

2016-04-11.No 01.Fire and wind farm turbine.OHP.Ray Anderson

(Image: Oklahoma Highway Patrol/Roy Anderson)

Arcing power lines sparked fires early Tuesday afternoon approximately six miles north of Woodward. Four fires merged into one fire. Firefighters from across the state responded to the call, yet even with the assistance of five aerial tankers by Thursday morning the fire had burned 54,200 acres and was only 10% contained. For this fire, named the 350 Complex, it would be take until the morning of April 11 to reach 80% containment. Continue reading

Rain Forecast as Hourly Graph

A couple of common questions we all have are, “When is it going to rain?” and “How much rain will we get?”

There is a tool from the National Weather Service that can give insight into both of those questions. The product is the National Weather Service’s Hourly Weather Forecast Graph. The Hourly Weather Forecast Graph shows forecasts of the chance of rain, amounts over time, and when to expect rain.

2016-02-26.Ag Blog.No 01.Storm clouds

Continue reading

Adding Assurance – Dual Rain Gauges

When rainfall data counts, it’s a shock to go to the Oklahoma Mesonet and find ‘NA,’ ‘Not Available.’ Just like you, all of us at the Mesonet hate missing data too. That is why we are so committed, from our field techs to our website wizards, to collect and confirm all the data we can from the Oklahoma Mesonet system. The Mesonet team works continually to make sure that quality assured data keeps flowing from Mesonet’s 120 sites, every five minutes, every day.

2015-12-22.No01.AgBlog.Mesonet Team

(Part of the Oklahoma Mesonet Team at the Ron Elliott Mesonet Site Dedication – 09/11/15)

Continue reading