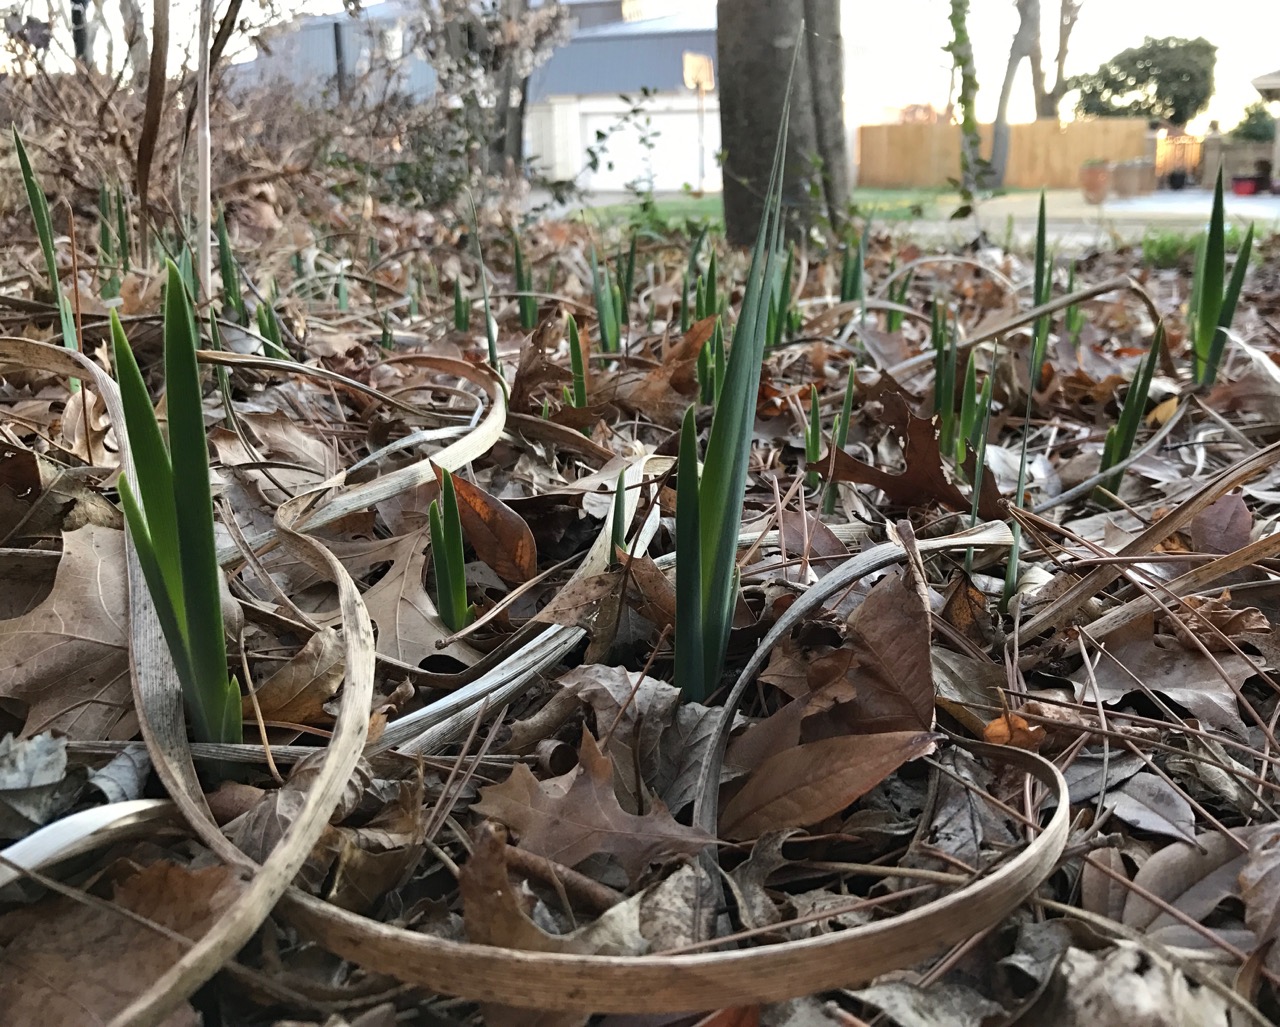
Has spring sprung? The calendar says NO! It’s February 21st. But what does the calendar know? Oklahoma’s plants and weather tell us that spring’s onset has begun. These iris are under a heavy mulch of leaves and in a low light area. That hasn’t slowed their emergence. Picture taken February 21, 2017 in Chickasha, OK.
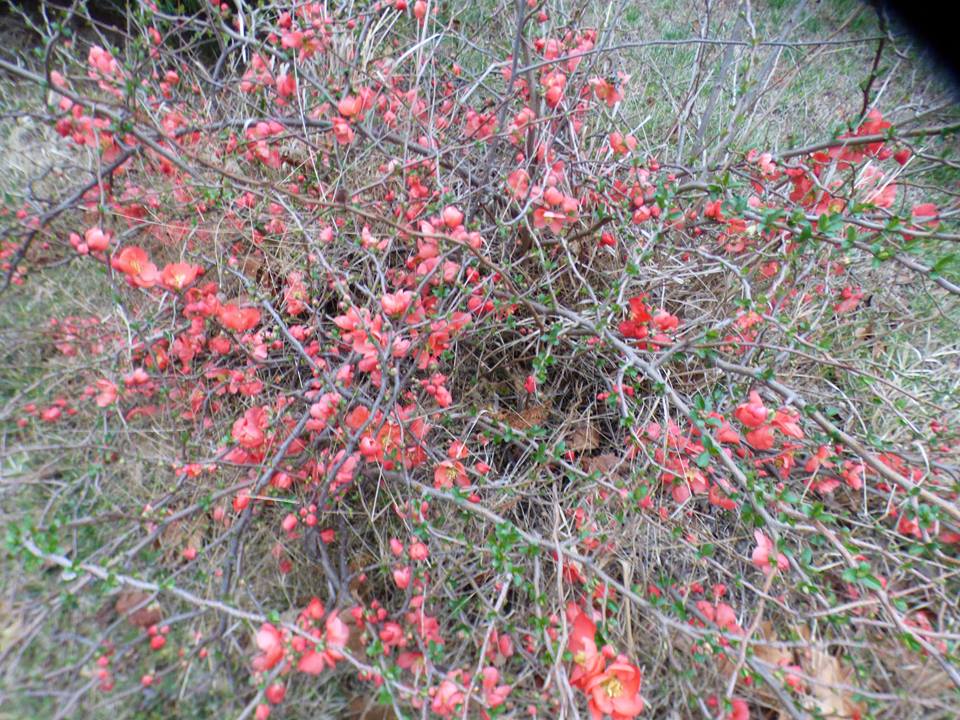
This flowering quince was moving past bloom near Newcastle, OK on February 20th. Note the flush of green leaves. The leaves tell us this plant is at the end of its bloom period. Picture courtesy of Sharon Beasley.
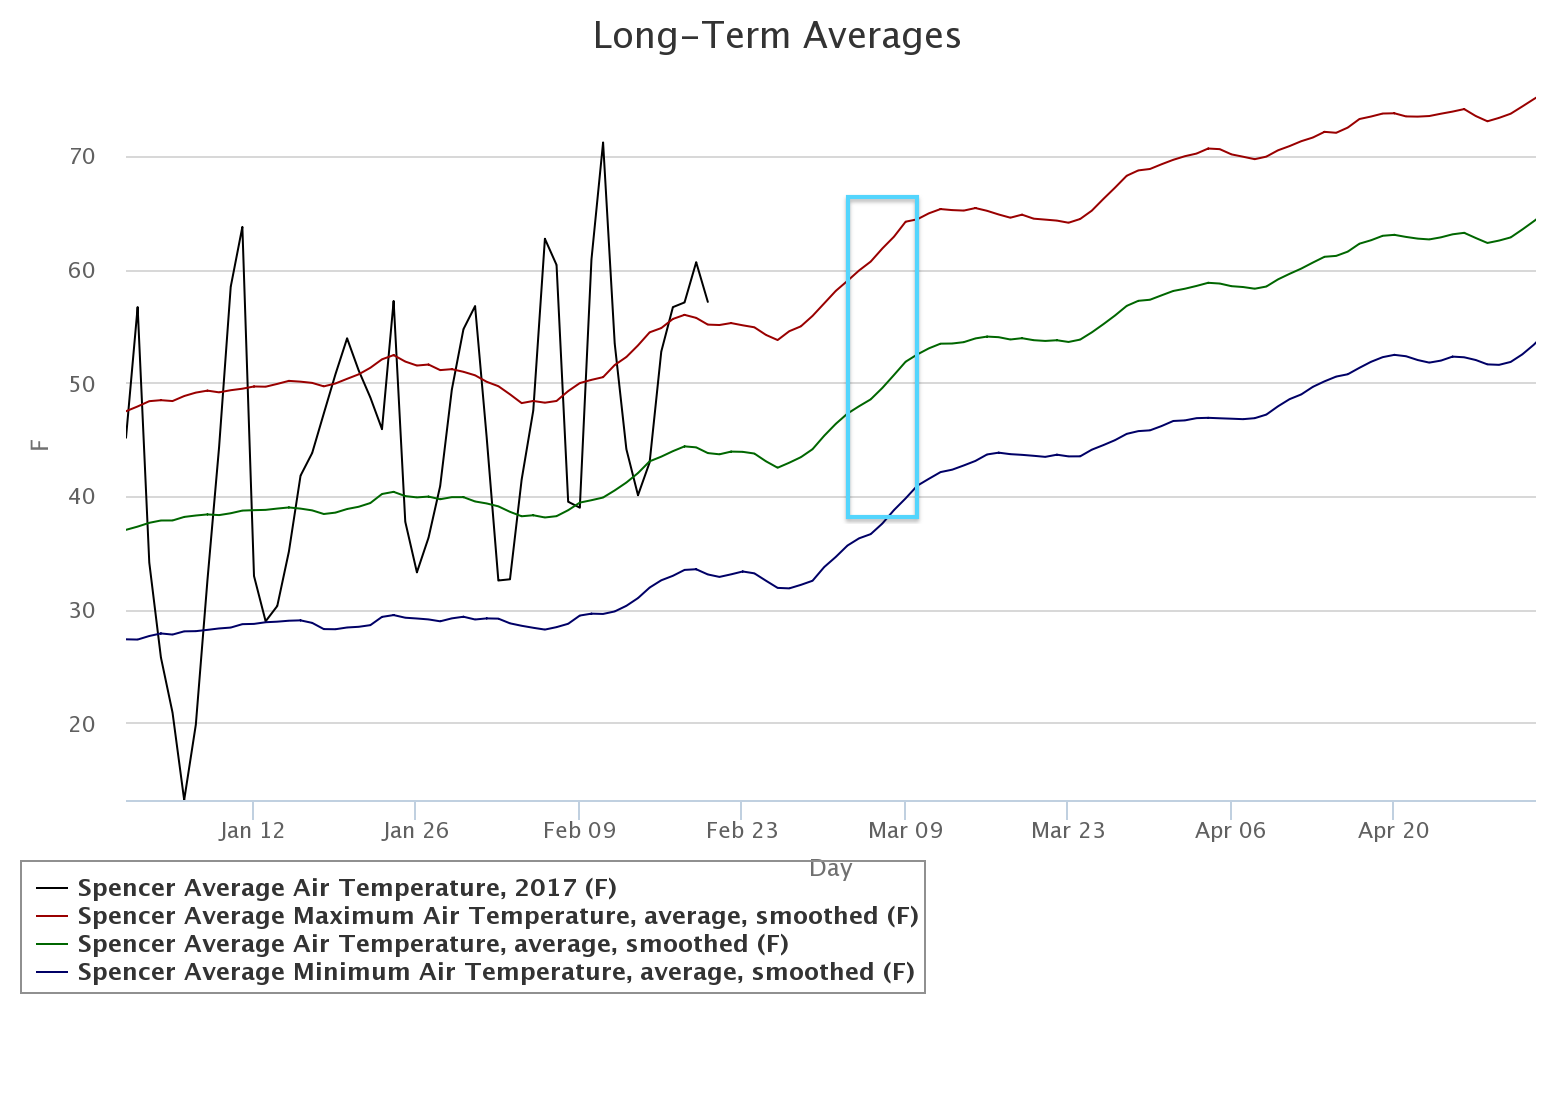
For an air temperature perspective, take a look at this Oklahoma Mesonet temperature graph for Spencer. This shows the current year’s daily average air temperatures (black line) against the Mesonet 15-year averages from 2002-2016.

The red line shows smoothed maximum air temperature averages. The green line are smoothed daily average air temperatures. The blue line shows smoothed minimum average air temperatures. Smoothing is done by averaging eleven days, five days behind, the day of interest, and five days ahead.
If we were experiencing typical air temperatures, the daily averages over a week or more would track around the green line. Cooler days would be close to the blue line and warmer days close to the red line. We see that from January 1 to 20th.
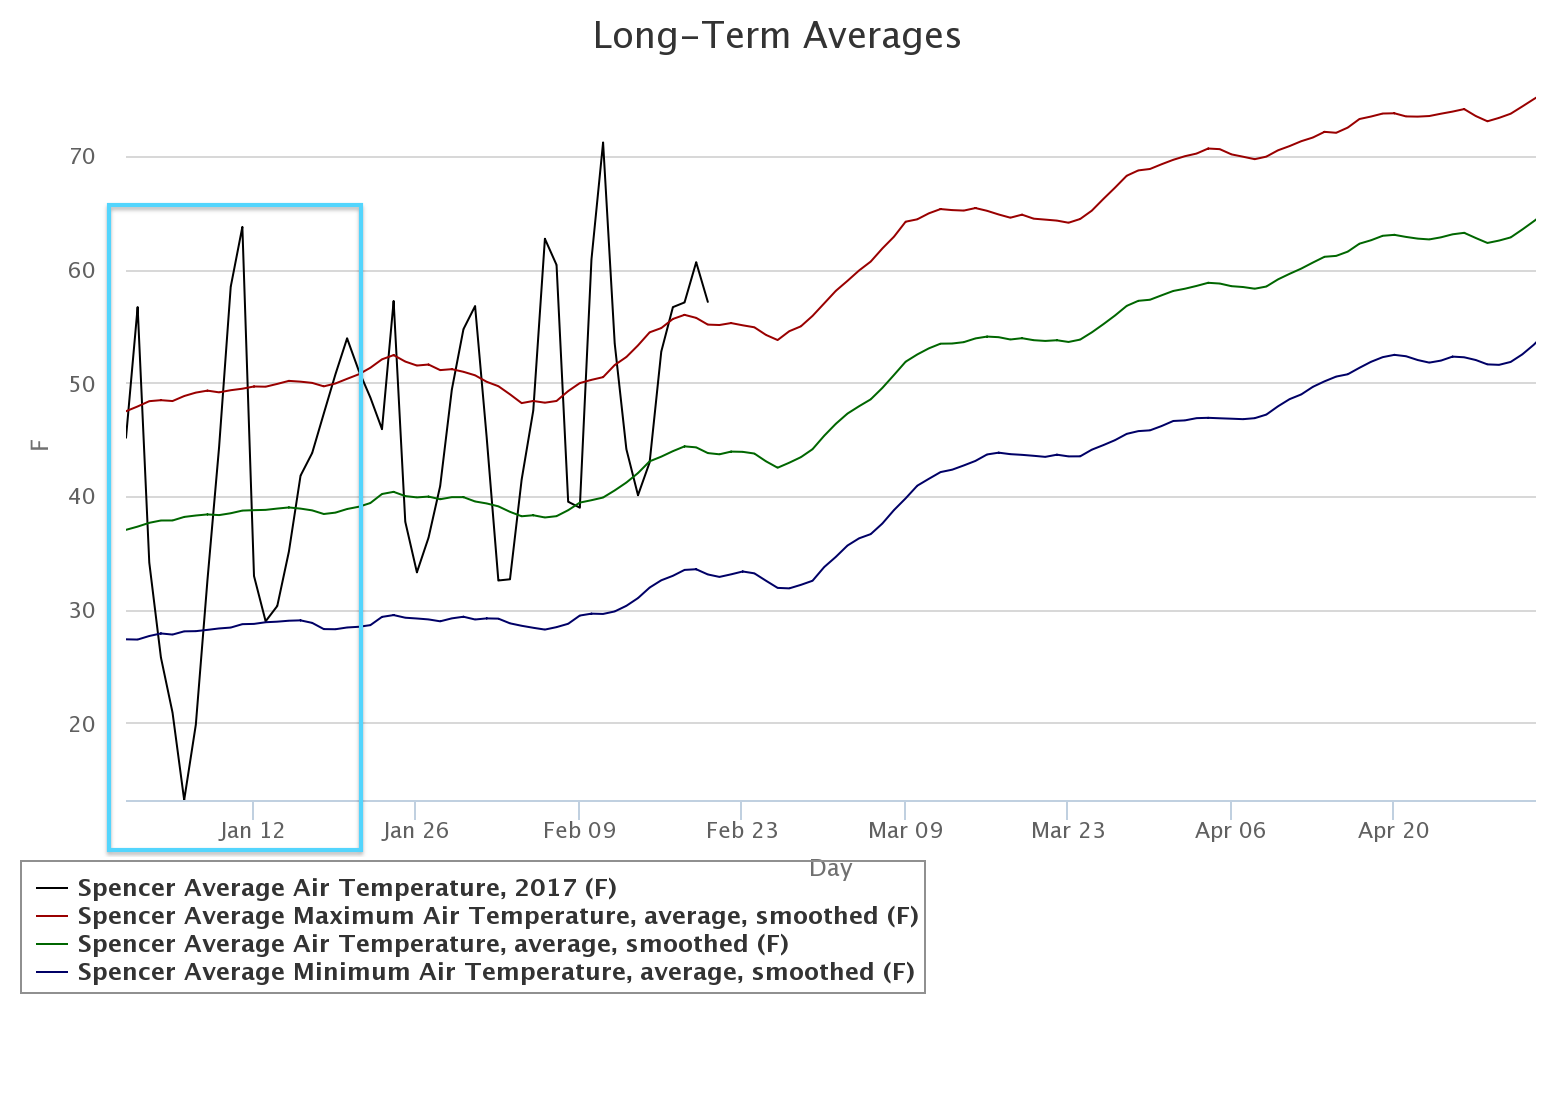
After that, daily averages shifted up, so that the coolest days were above the blue, minimum temperature line from January 21st to February 5th.
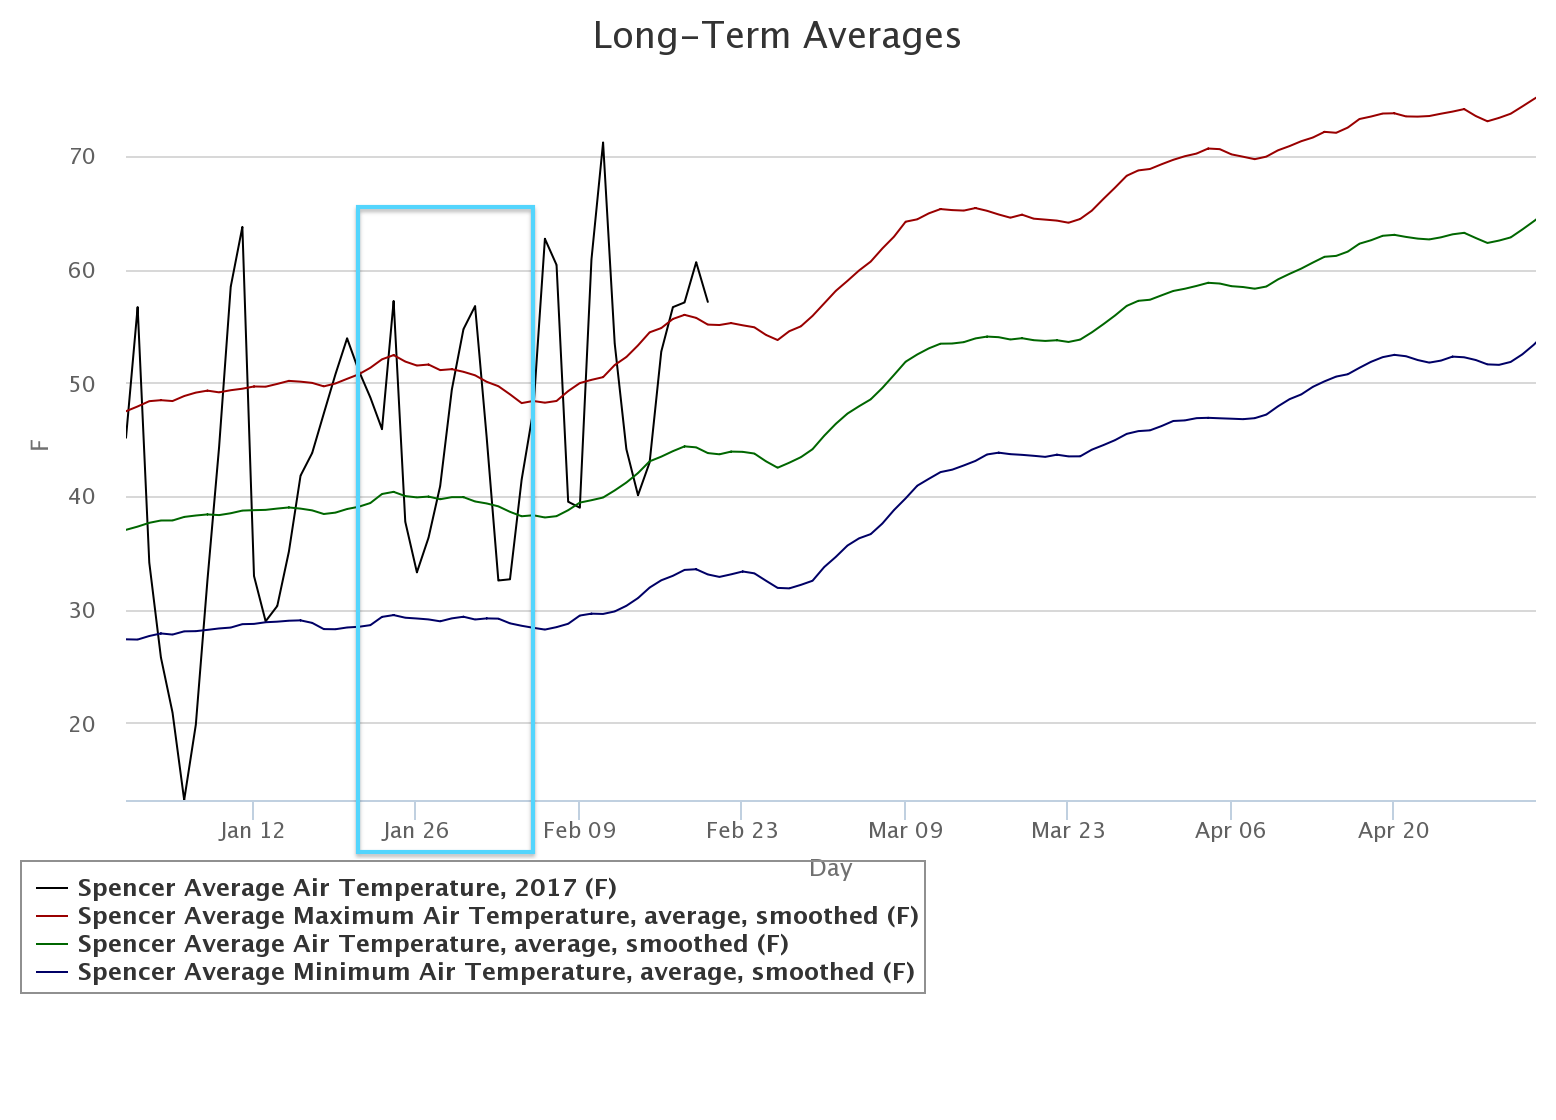
February 6th through the 20th the daily averages shifted up again, with the coolest days near the green, average line and the warmest days well above the red, maximum average line.

Sliding ahead on the graph gets us to dates when the air temperatures for February in 2017 typically occur, around March 7th through the 9th. So for the Spencer Mesonet site, air temperatures from February 6th to 20th were more typical of March 7th to 9th Mesonet long-term averages. That’s a big leap ahead of normal!
If you want to check out the Mesonet site closest to you, go to Mesonet / Weather / Past Data & Files / Long-Term Averages – Graphs. The air temperature graph is the default graph. There are 121 Mesonet sites. Only data for sites that have been operational since 2002 will have 15-year long-term averages.
If March stays mild, like it did in 2012, we can expect some excellent winter crops and an early season on summer crops. If March brings frigid temps, this year’s early spring will turn out to have a truly ugly side to it.