So when you think about air moisture do you think dewpoint or relative humidity? Get a group of meteorologists together and they’ll soon bring up dewpoint temperatures and its role in severe storms. Get a group of farmers together and they’ll fill you in on how they watch relative humidity for baling hay and prescribed burns.
Meteorologists turn to dewpoint temperature to find out if and where a dryline exists, so important in the southern Great Plains. Dewpoint temperature let’s them know the temperature that the air has to cool to for a cloud to form. They monitor dewpoint to track movement in the dryline and variation between drier and wetter conditions in the lowest portion of the atmosphere. For severe weather, you need warm, moist air. That air will feel heavy, stuffy due to the high amount of moisture in it.
The rest of us maybe weather novices and not as comfortable with dewpoint temperatures, yet we too can use Oklahoma Mesonet dewpoint maps to gain insight into where conditions are ripe for storms to pop up.
On a dewpoint map from Monday, May 9, 2016 at 2:00 pm, there was a distinct dryline across Oklahoma. A number of areas had dewpoint temperature differences that went from the upper thirties to the low sixties within the width of a single county.
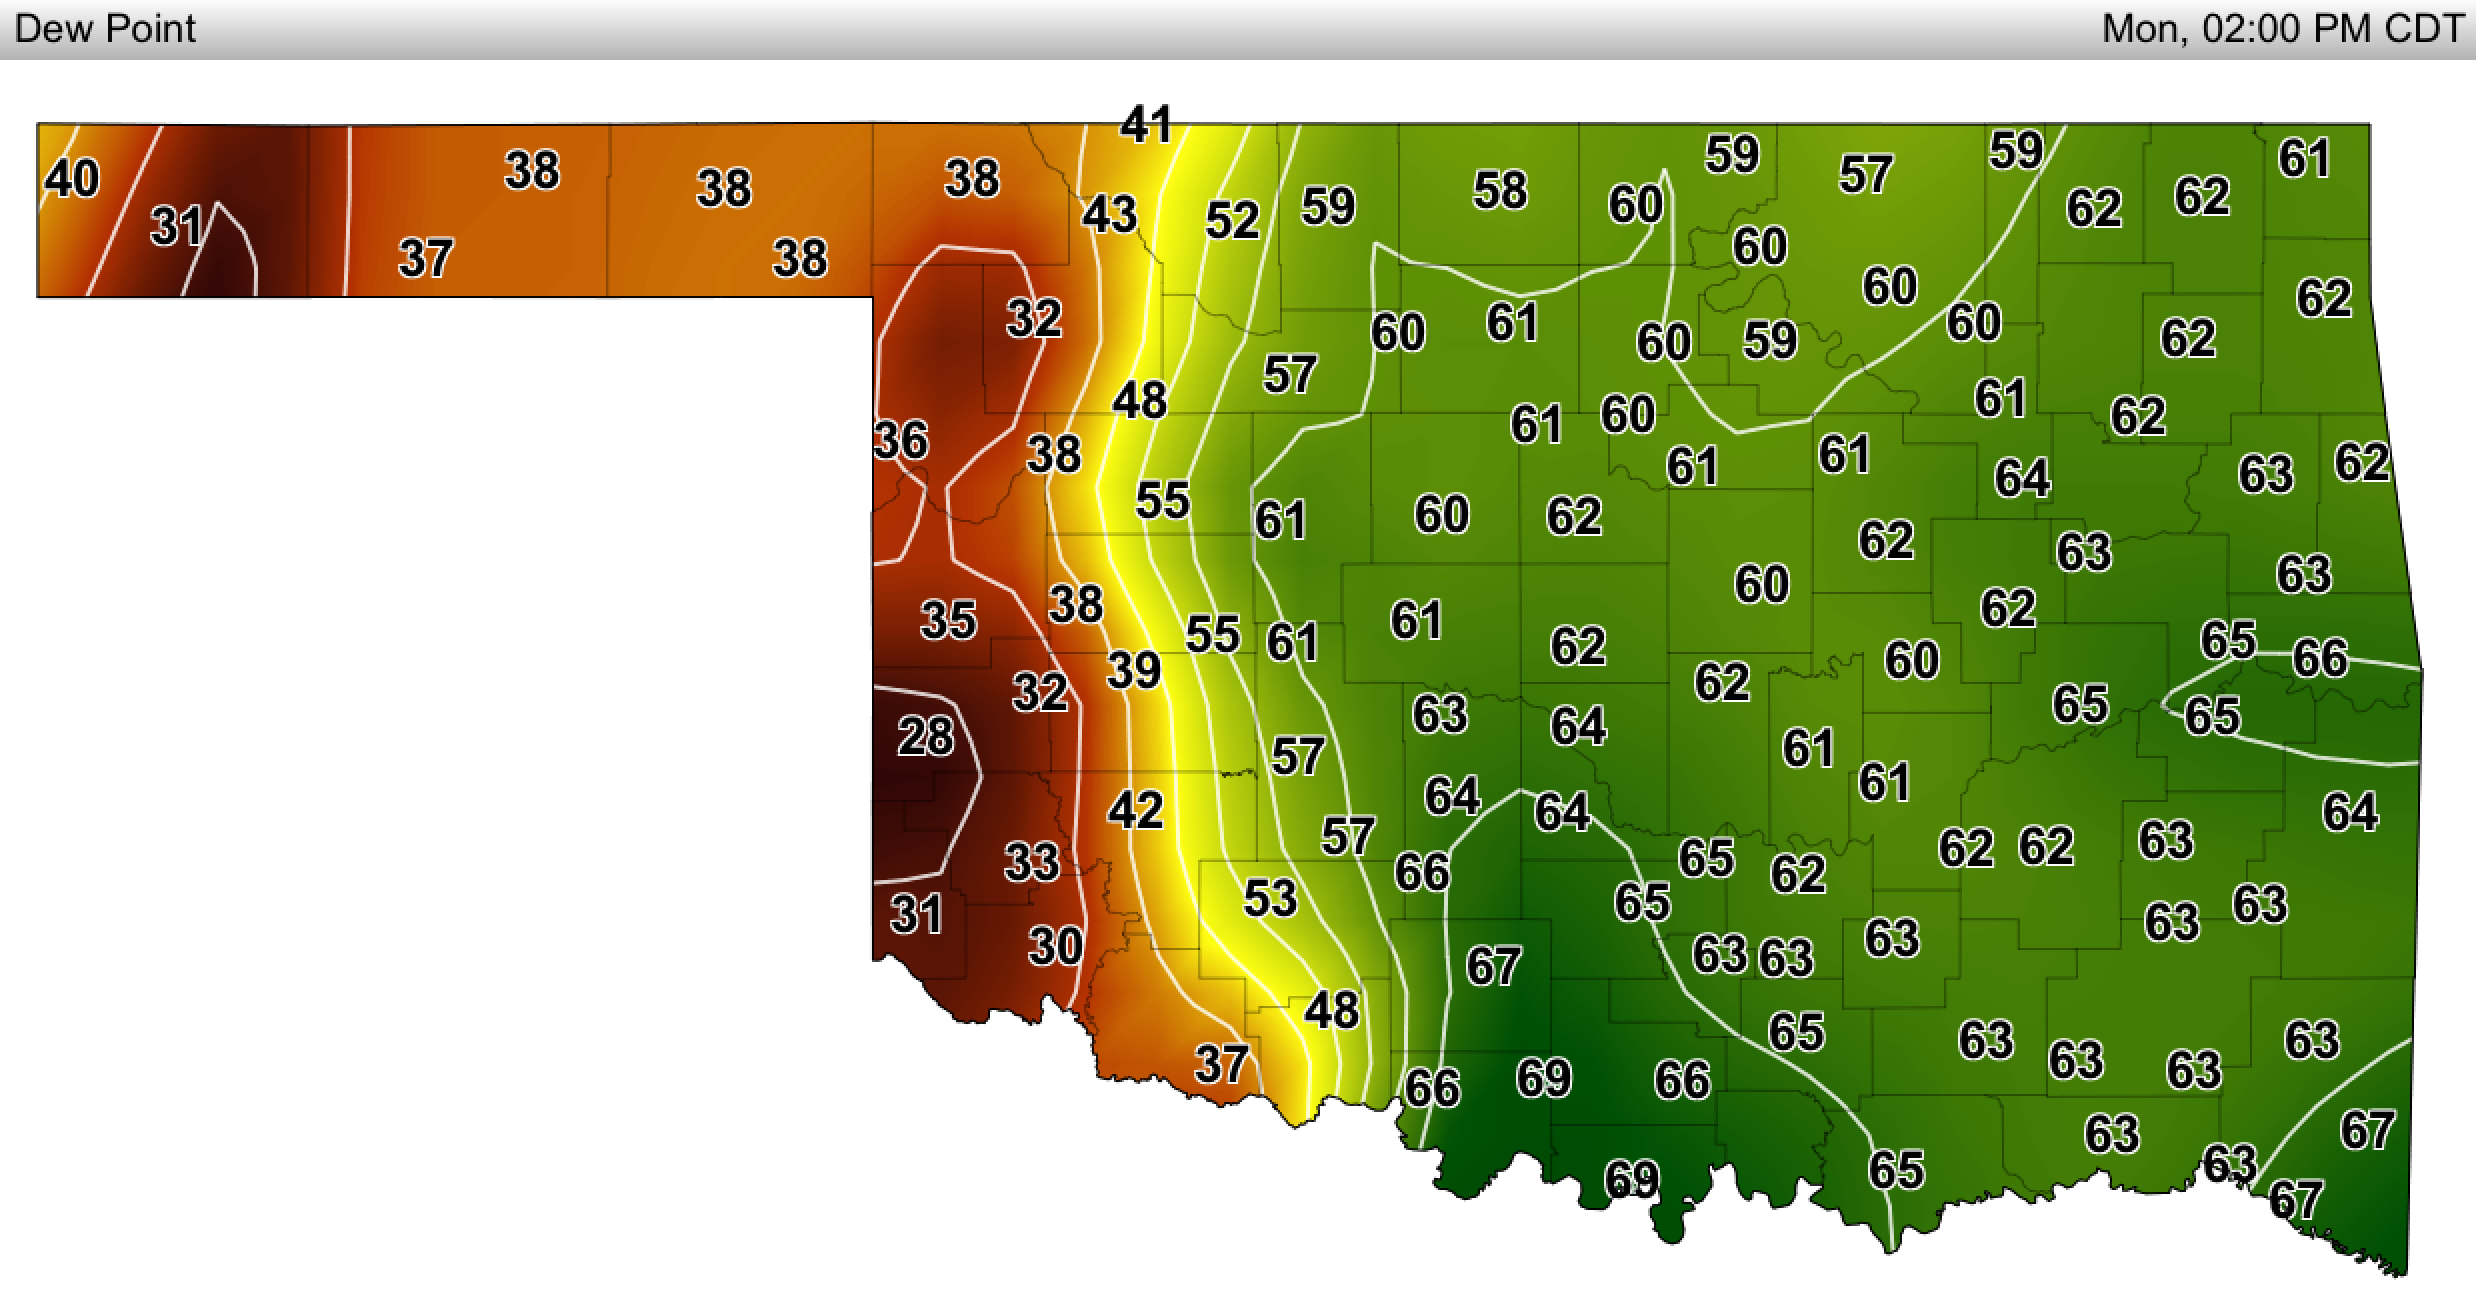
Higher dewpoint temperatures, the green colored map areas, show where there was more moisture in the atmosphere. Camargo was on the dry, west side of the dryline at 38 degrees. The air near Watonga had a lot more moisture and a dewpoint of 61 degrees. To the south, Grandfield was 37 degrees and Waurika 66 degrees.
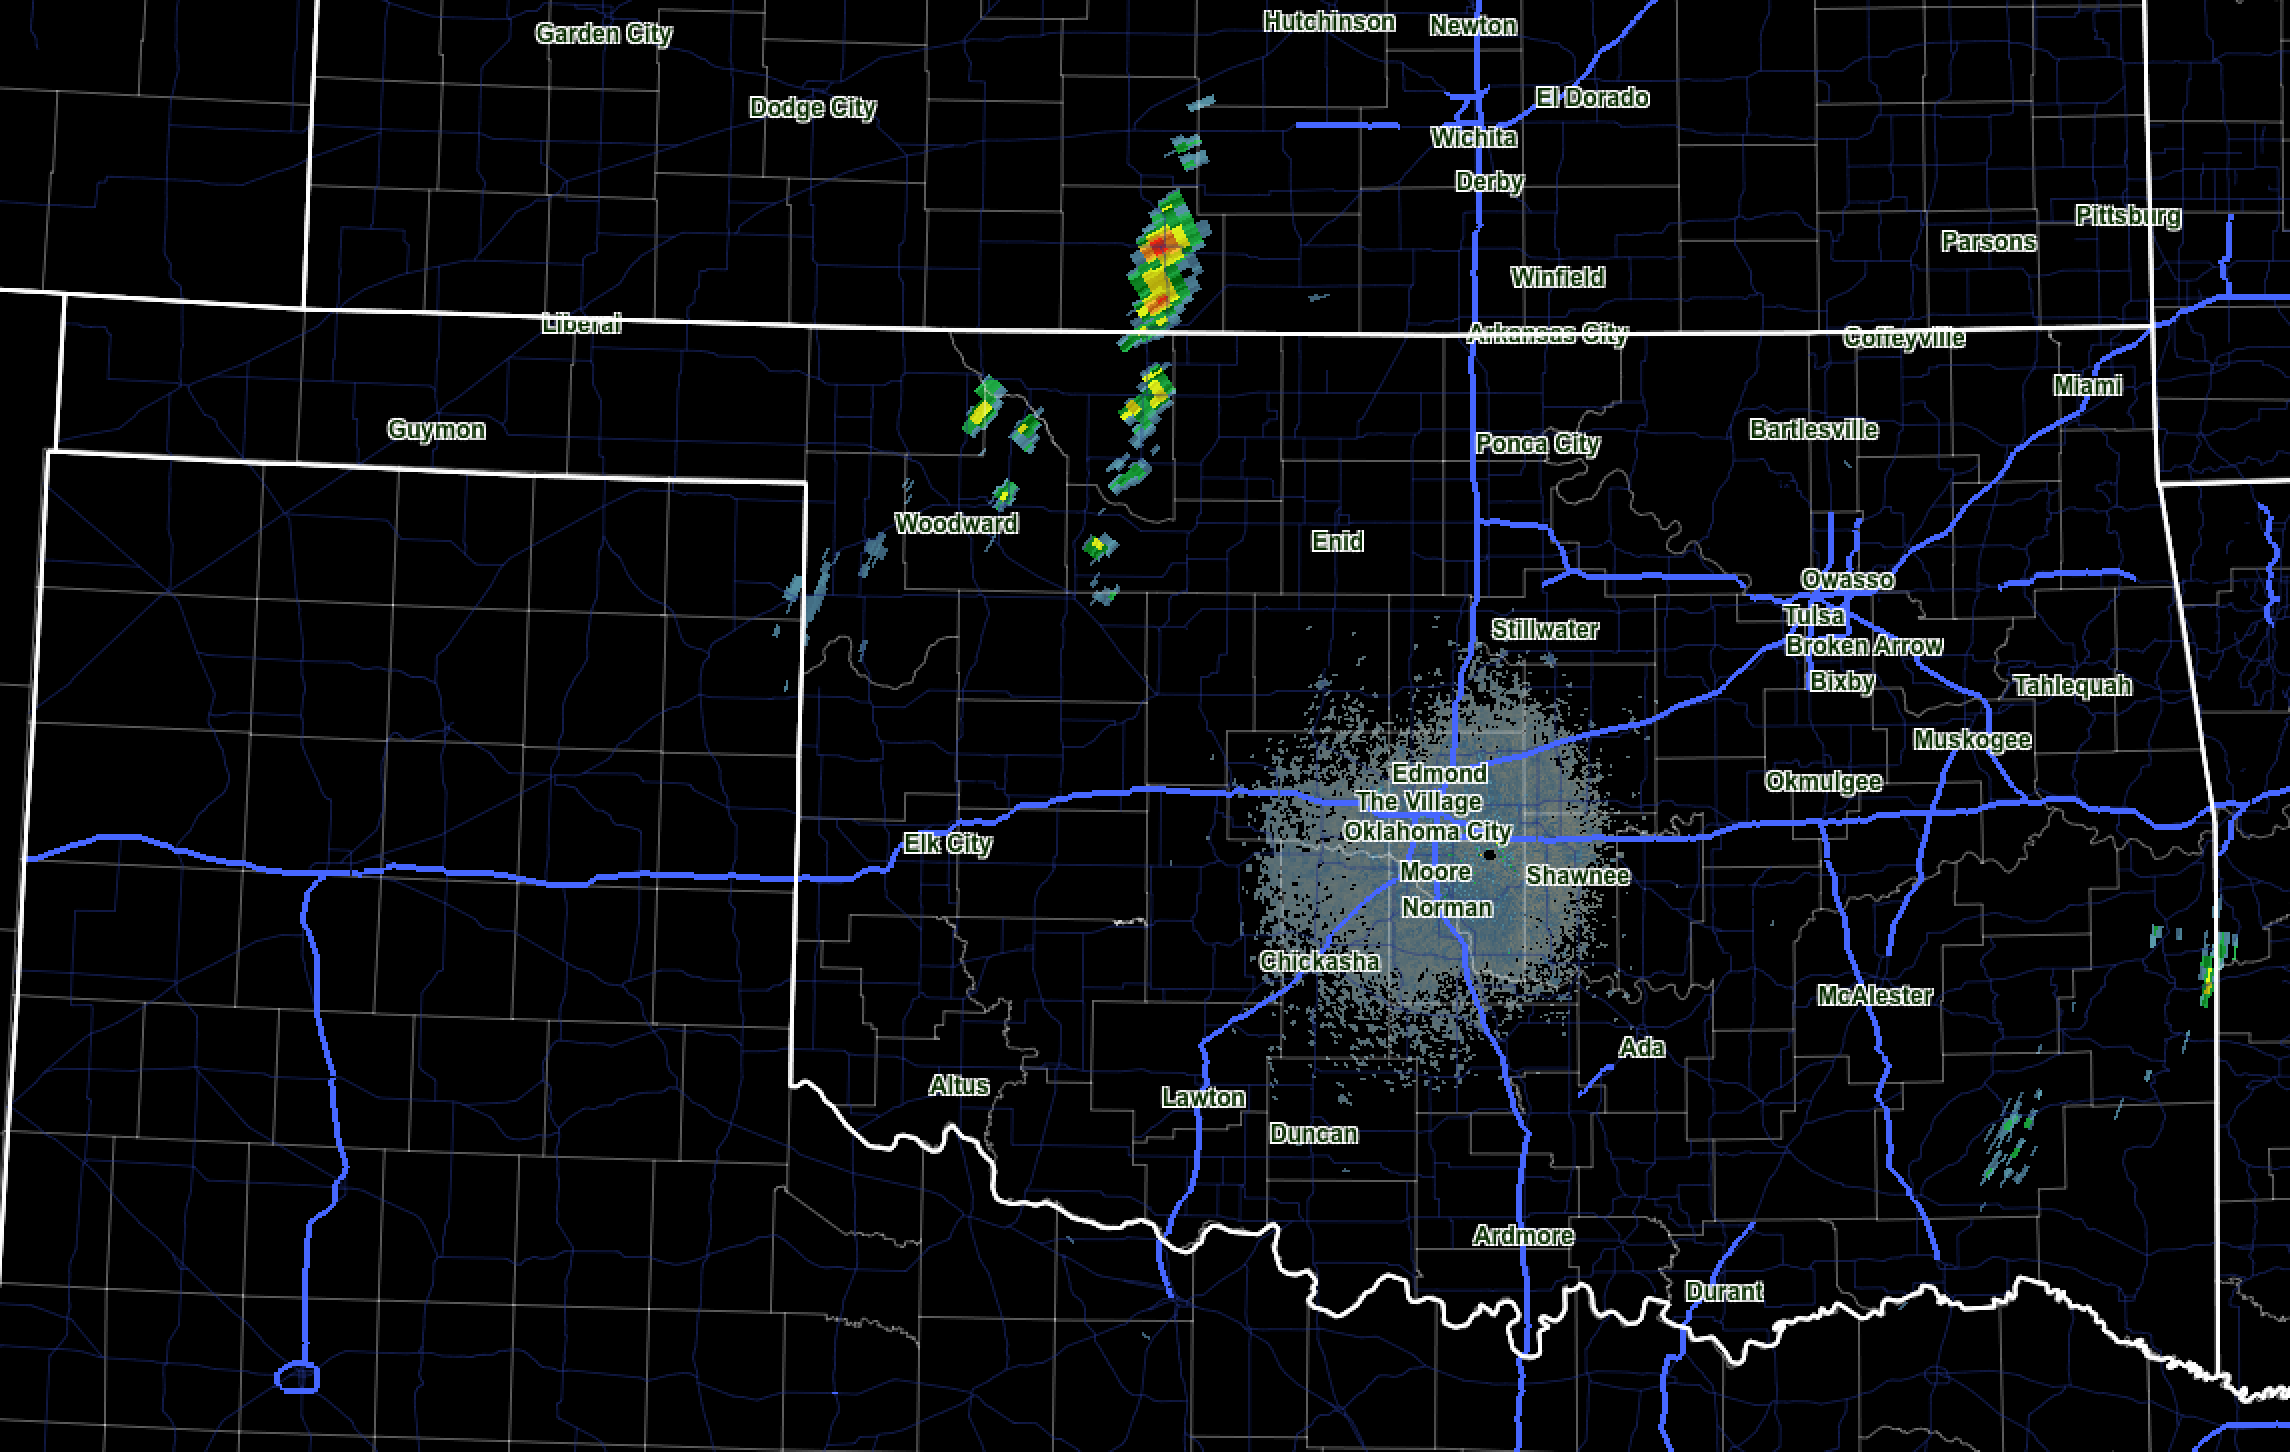
At 2:10 PM on May 9th, strong storms had popped up on the Oklahoma City radar north and east of Woodward. The strongest cells were in Kansas. The line from Kansas to the southeast of Woodward ran along the east edge of the dryline.
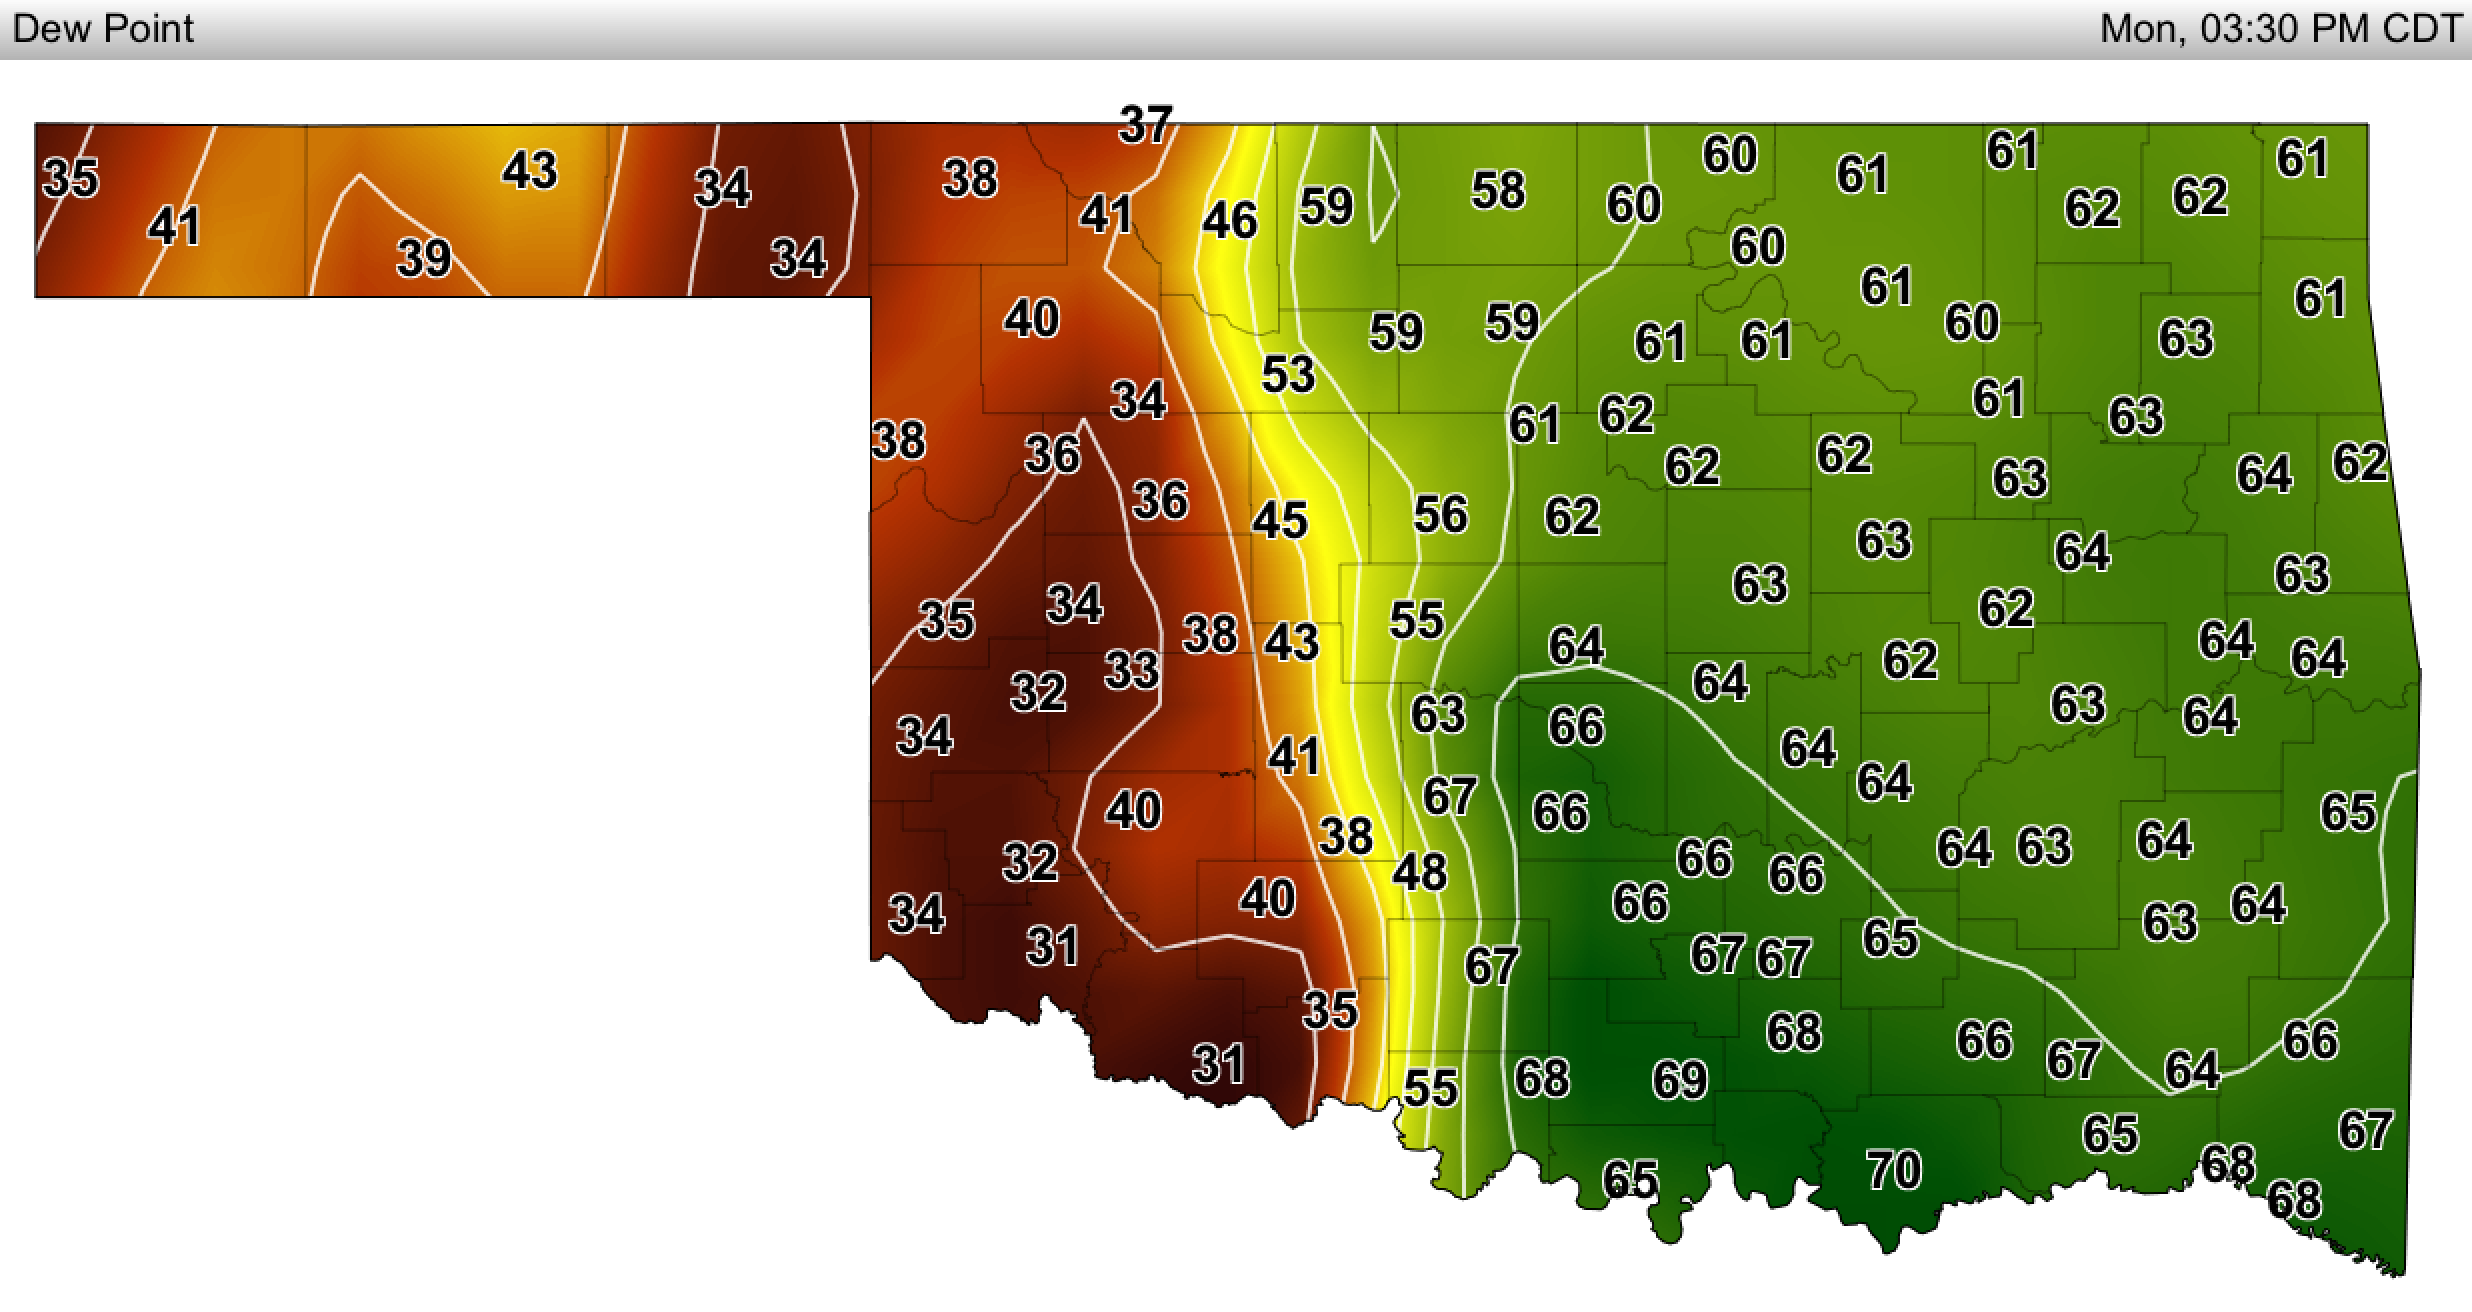
An hour and a half later at 3:30 PM, the dryline had moved farther east and the distance between dry air and wet air masses was even closer in some cases, such as between Apache with a dewpoint of 38 degrees and Ninnekah, twenty miles away, at 67 degrees.
Severe storm cells like the strong ones that brought tragic fatalities, injuries, and damage to Oklahoma on May 9th formed along the eastern, moister side of the dryline. They formed in areas with dewpoint temperatures in the upper fifties and sixties. Meteorologists consider 55 degrees Fahrenheit and above a necessary ingredient for severe thunderstorms to form.
On the Oklahoma City radar at 3:40 PM, the storm that would produce an EF-4 tornado was visible in western Garvin County. It formed where dewpoint temperatures were in the mid-sixties. And the storms near Woodward in the previous radar image had strengthened and grown to cover more area. They had also moved east closer to Enid as the dryline shifted east.
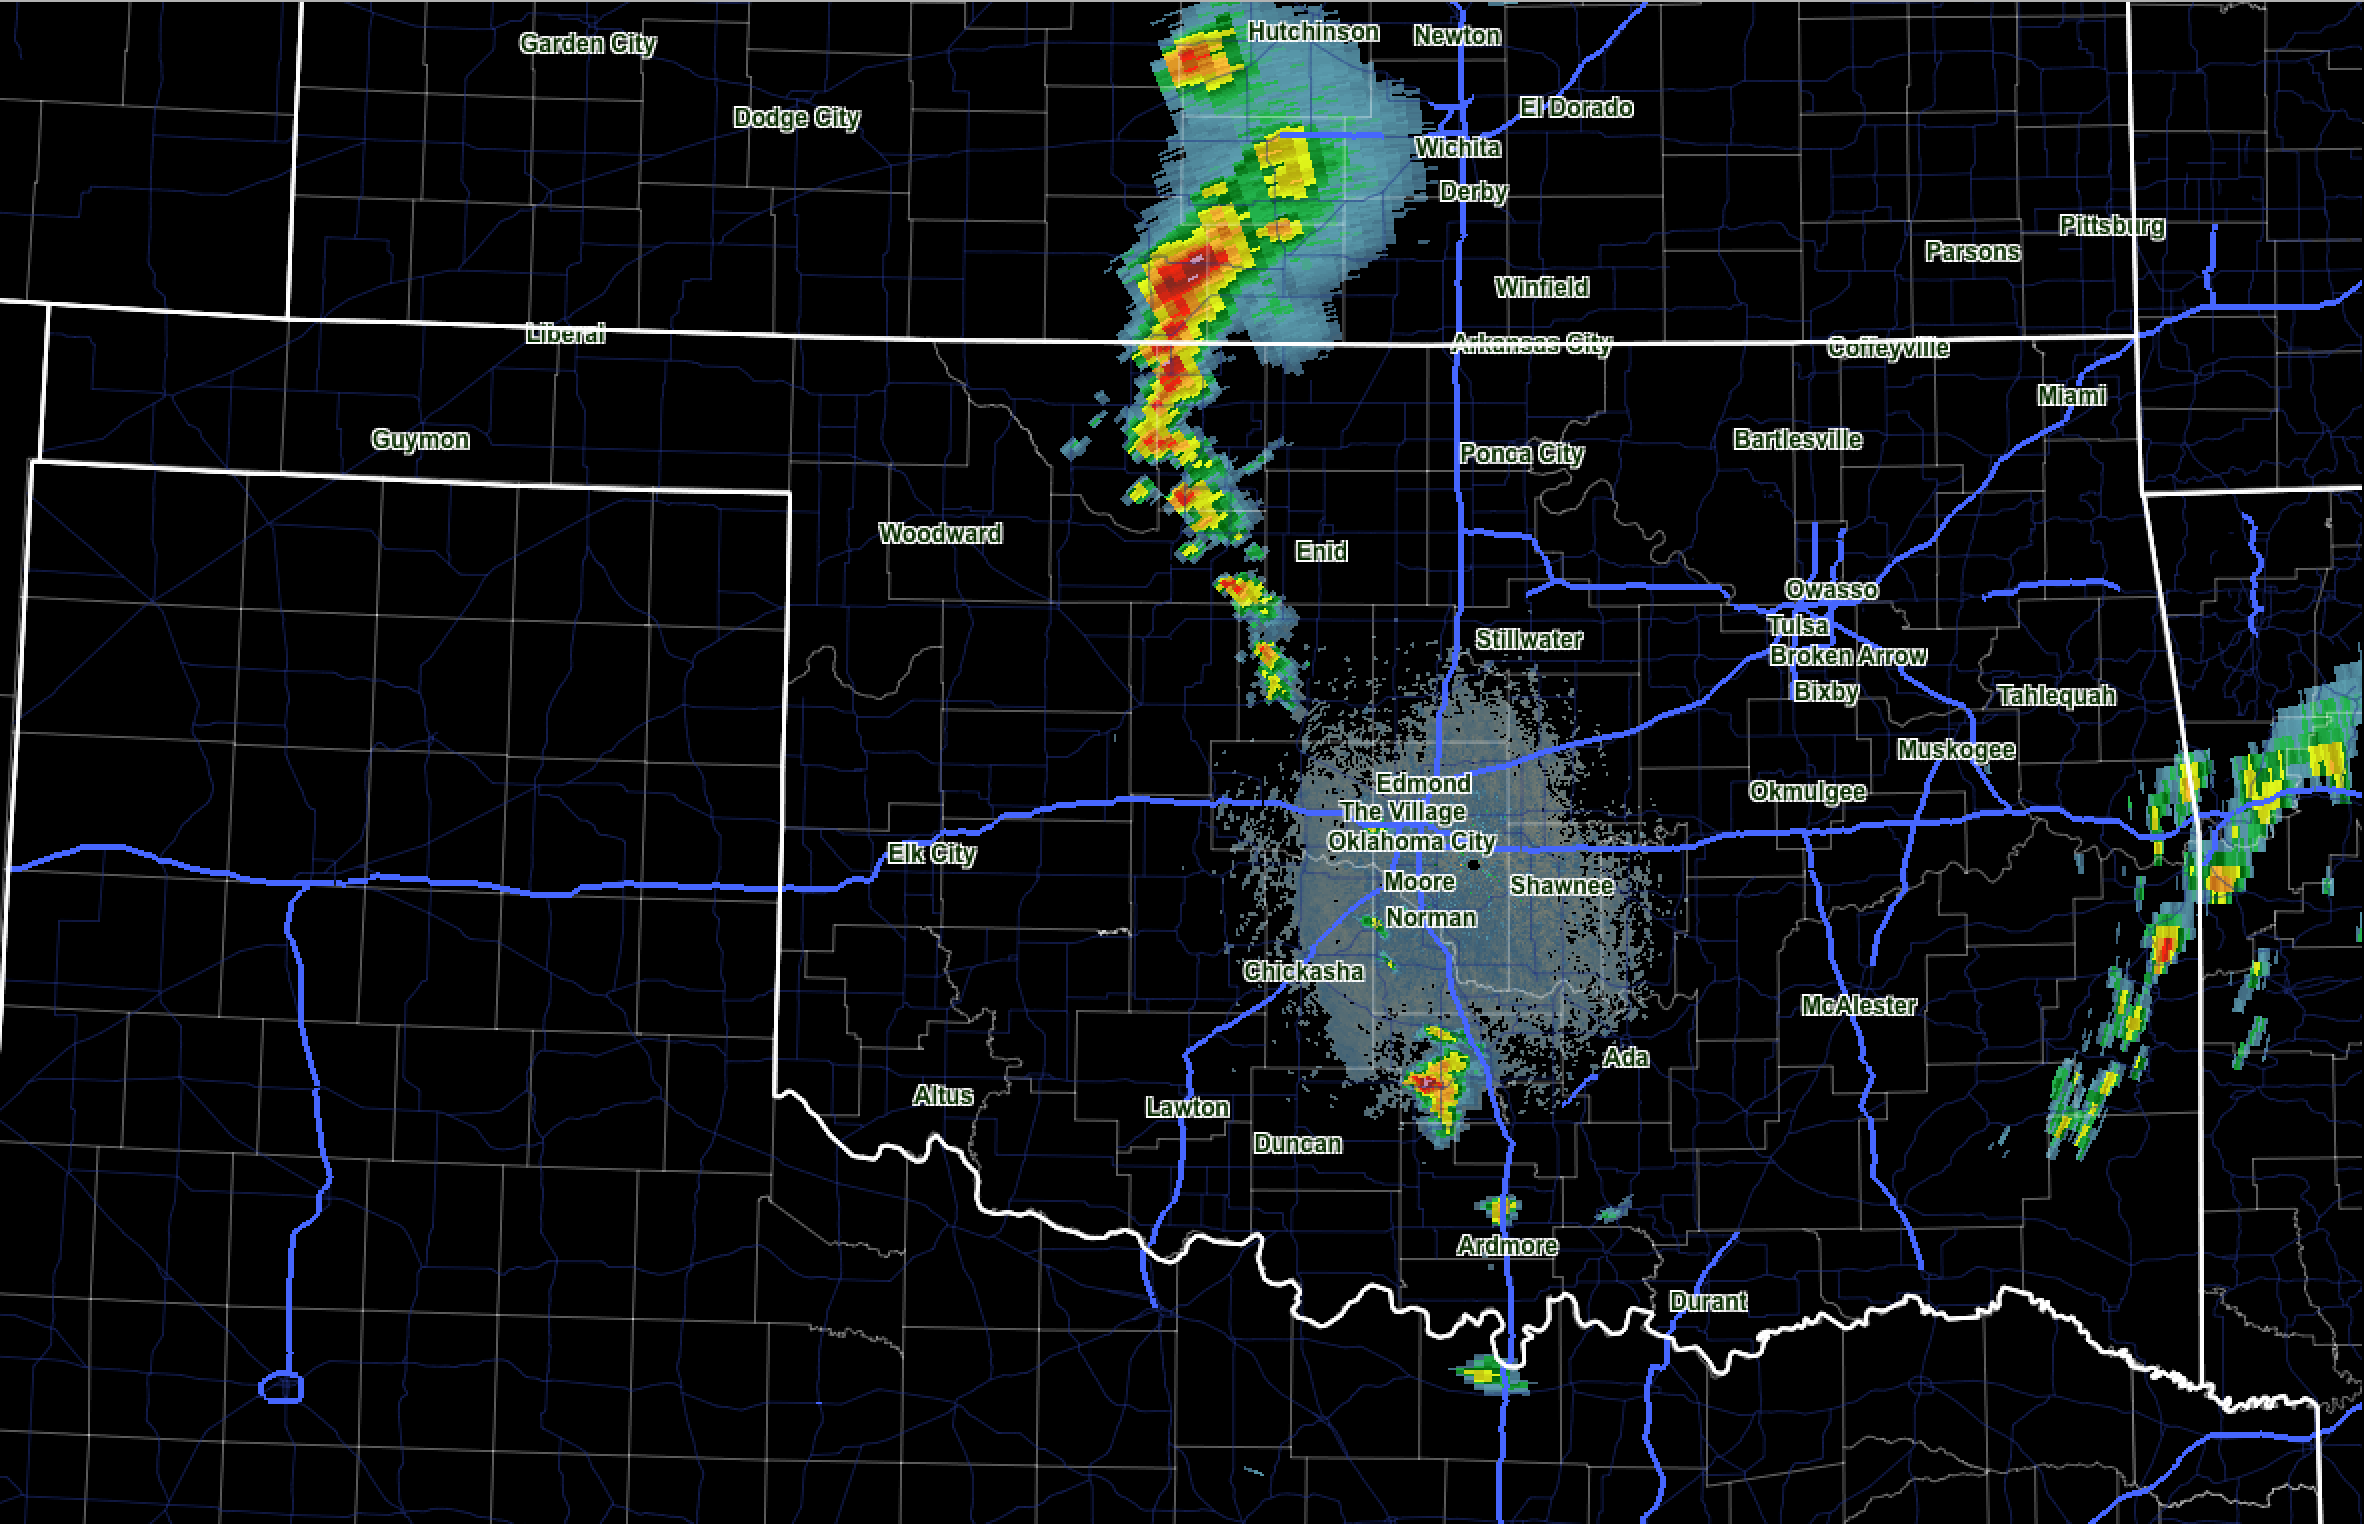
On the 3:40 PM radar image you also see a line of storms forming on the border of Oklahoma and Arkansas. These highlight that atmospheric moisture, east of a dryline, is only one ingredient of storm formation.
A map from the National Weather Service’s Norman Forecast Office shows the tornadoes that formed in south central Oklahoma on Monday, May 9th. The red line was the EF-4 in Garvin County. The orange tracks were EF-3 tornadoes that set down in Murray and Johnston Counties. A yellow line shows an EF-2 tornado that formed in Bryan County. Green lines show the track of two EF-1 tornadoes.
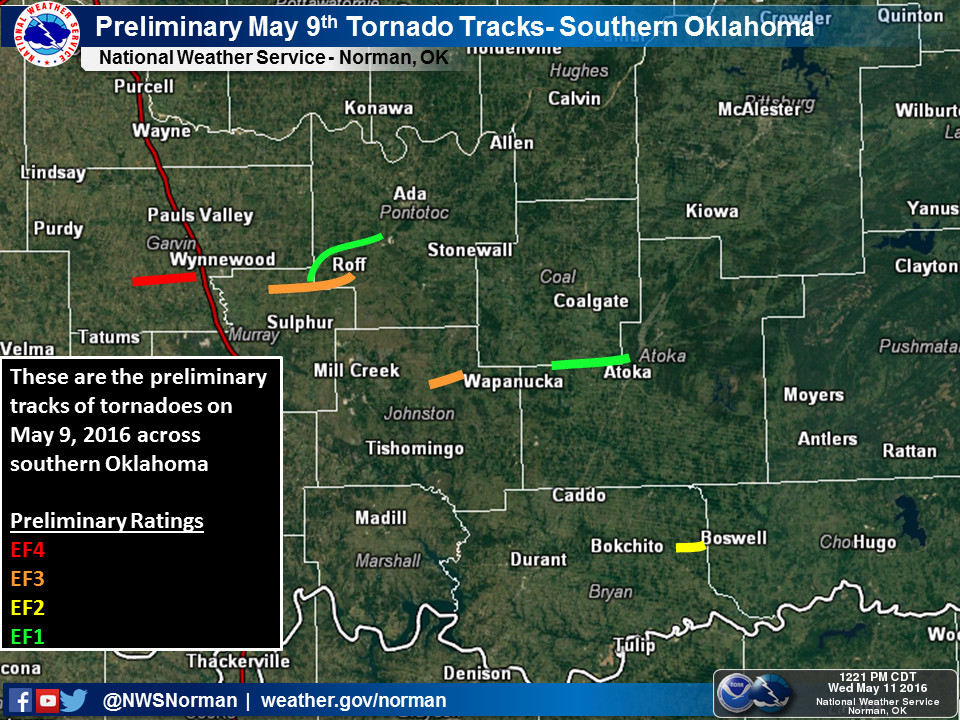
This map doesn’t include an EF-1 tornado near Glencoe and an EF-2 tornado near Boswell on May 9, 2016.
Dewpoint maps are another way to give you a heads up on severe weather days. Getting more familiar with dewpoint just takes some time. Checking dewpoints on storm days will give you new insights into the significance of dewpoint temperature changes and how they can indicate where storms are likely to form.
This is amazing work, and excellent article. THANK YOU so much, all involved with the MESONET Technology and Resource so valuable to Oklahomans.
John, we’re happy to be a valuable resource to all Oklahomans.