Heat and Cattle Comfort

With the shrill sound of cicadas pulsing around me, I began my walk along the path through the trees. Here it was Friday night in Ardmore. The day to follow was a full day devoted to beef cattle production at the 2014 Southern Plains Beef Symposium. This was a beautiful evening. It was hot and humid, yet it was a pleasant warmth. The grass was green and soils moist from recent rains.

As I walked, the sweat began to flow. Two miles and forty minutes later, I was warm, wet from perspiration, yet not fatigued, not overcome by the heat. At the end of my walk, close to 8:00 pm, the human Heat Index also referred to as the Apparent Temperature from the Newport Mesonet site was 87°F. That’s important because while I was sweating, I was still comfortable. Warm, yet far from being overcome by the heat. For me, when the Apparent Temperature gets into the upper 90s, I have to slow down and take it easy or suffer from the heat.

2014 08 10.Newport Air Temp graph

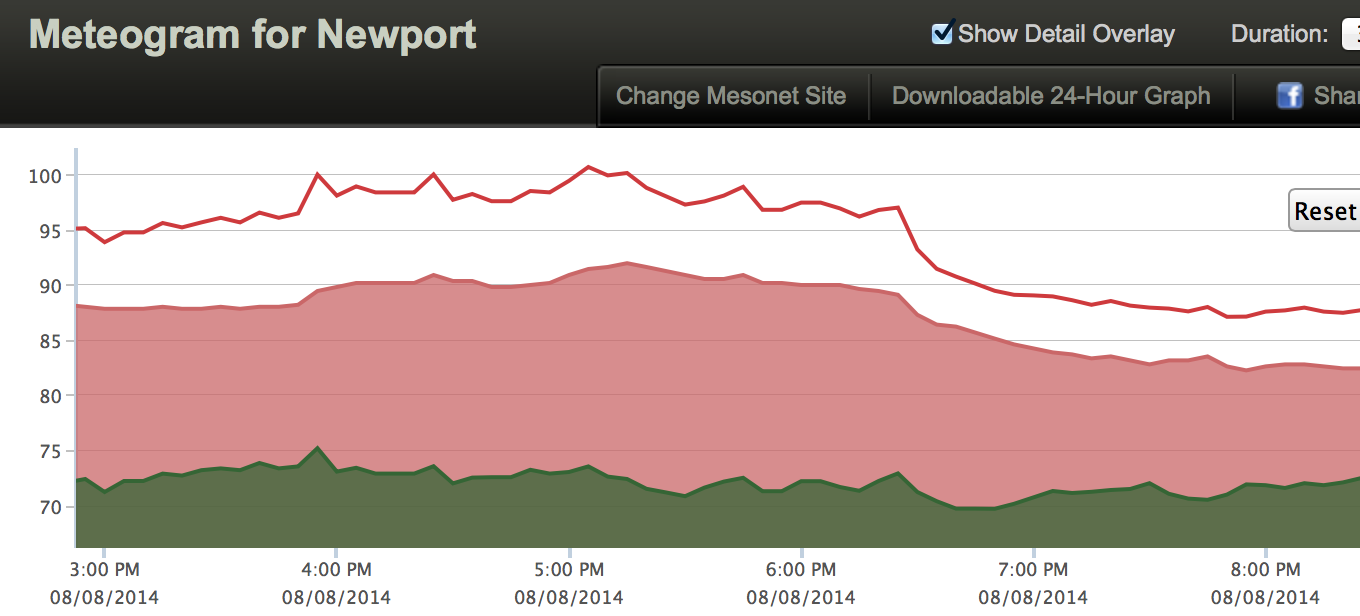
[Full Site: mesonet.org / Weather / Station Meteograms]
[App: Local / upper left corner "zig-zag" icon]

Continue reading

Ken Crawford, Man of Vision

“Hi Ken, great to see you again. Take a look at what we’ve been working on. We’re really excited about it! Do you have a moment?”

2010.03.02.Ken Crawford.Hanyangian.com

That was often the start of our recent visits with Ken Crawford, past Oklahoma State Climatologist and Oklahoma Climatological Survey Director. Just two of the titles Ken has been known by in his career. Along with director of the climate survey, Ken was also a University of Oklahoma School of Meteorology faculty giving him the opportunity he loved, to teach and guide students.

Continue reading

Historical Climate Trends Tool

Right in the middle of your conversation about how drought has cut hay production someone brings up climate. What pops into your mind? Do you have a picture of climate?

Drought is easy to picture. The empty ponds, low lakes, dried up crops are ready reminders of drought’s devastating impact. Weather is easy to picture. It’s what’s going on as soon as we step outside. Sun, wind, rain, heat, cold all give us an immediate picture in our mind. Pictures of climate? For most of us, it’s hard to picture climate. And if we can’t picture it, how can we get a grasp on the long-term cycles and patterns of climate? How can we know where in the cycle we are? How can we know what to expect?

One way to picture climate is with a graph over time. There is a tool that can be used to create graphs of climate for any of the 48 continental USA states or any of the 344 climate divisions. These graphs use data from NOAA’s National Climate Data Center back to 1895.

The tool is the Historical Climate Trends Tool made available through the Southern Climate Impacts Planning Program at www.southernclimate.org.

2014 07 19.SCIPP.Data Products page

Continue reading