Right in the middle of your conversation about how drought has cut hay production someone brings up climate. What pops into your mind? Do you have a picture of climate?
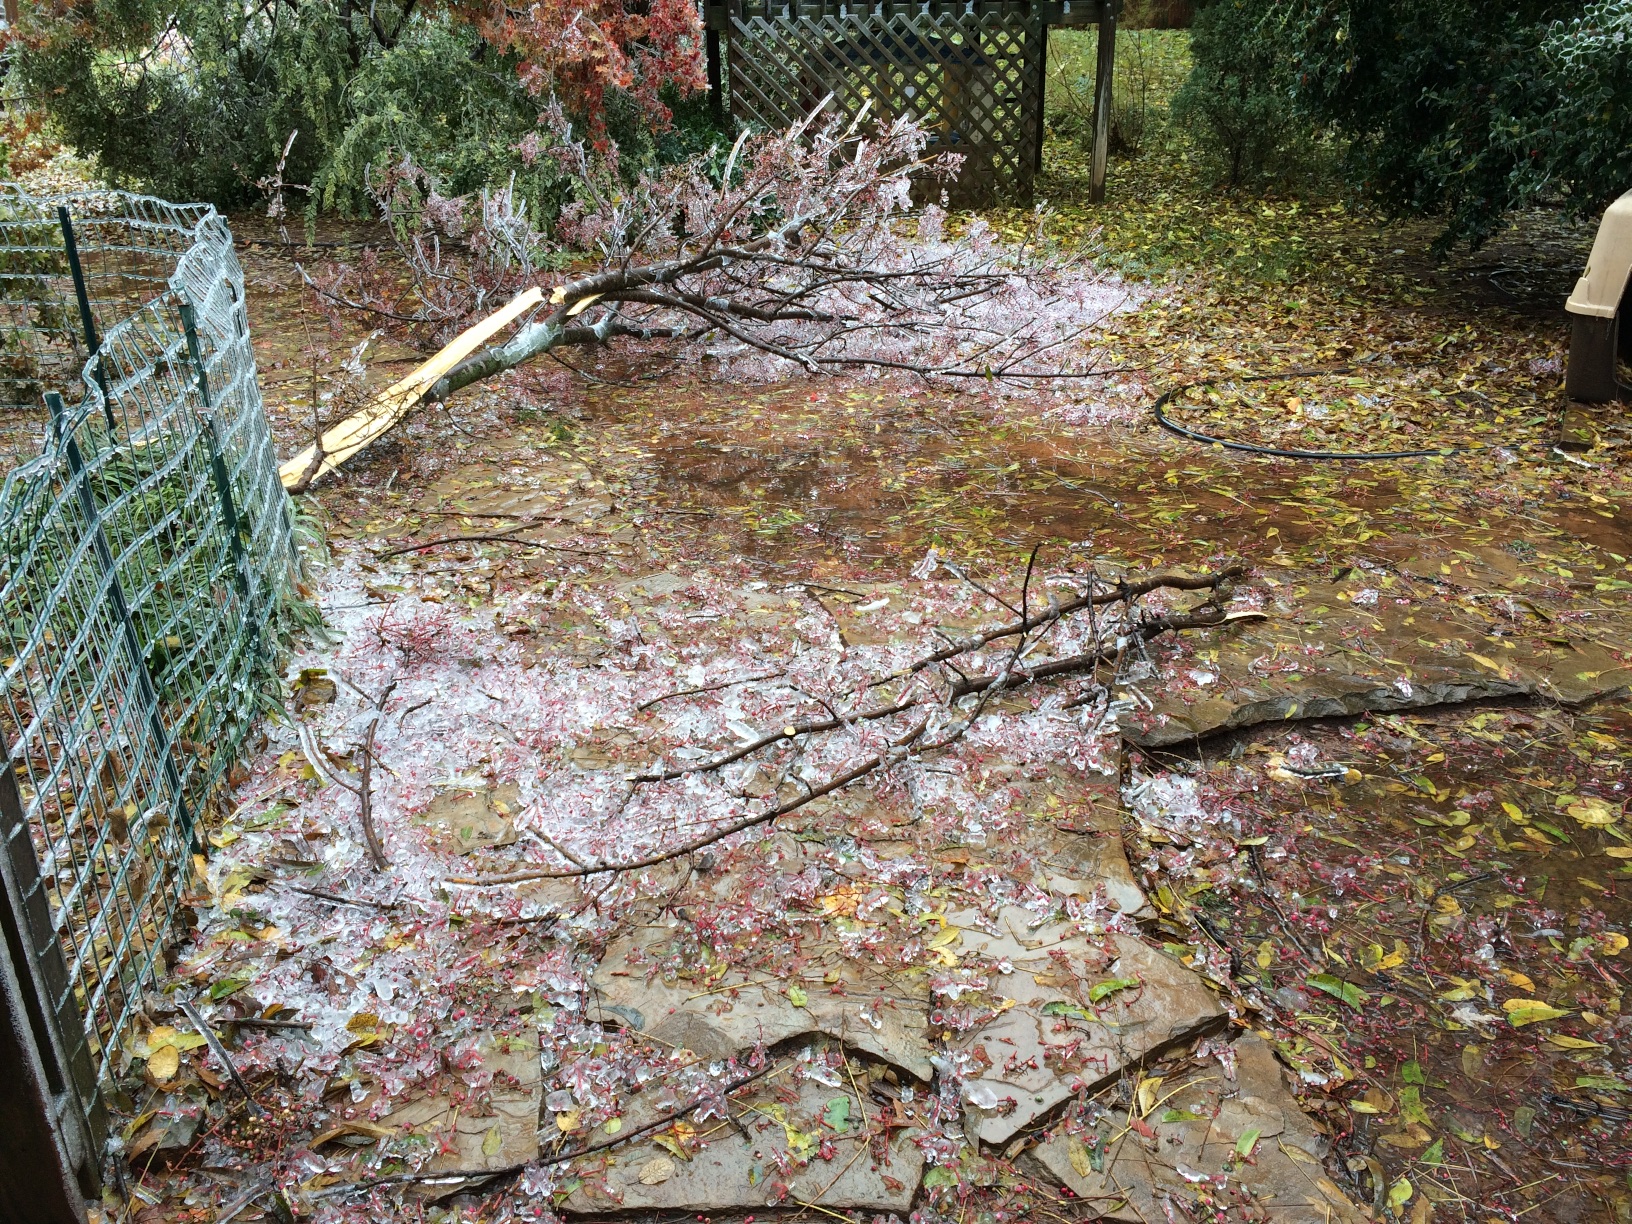
Drought is easy to picture. The empty ponds, low lakes, dried up crops are ready reminders of drought’s devastating impact. Weather is easy to picture. It’s what’s going on as soon as we step outside. Sun, wind, rain, heat, cold all give us an immediate picture in our mind. Pictures of climate? For most of us, it’s hard to picture climate. And if we can’t picture it, how can we get a grasp on the long-term cycles and patterns of climate? How can we know where in the cycle we are? How can we know what to expect?
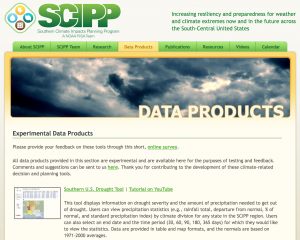
One way to picture climate is with a graph over time. There is a tool that can be used to create graphs of climate for any of the 48 continental USA states or any of the 344 climate divisions. These graphs use data from NOAA’s National Climate Data Center back to 1895.
The tool is the Historical Climate Trends Tool made available through the Southern Climate Impacts Planning Program at www.southernclimate.org.
Continue reading →