We entered 2015 with so much news about drought in Oklahoma and across the nation. Now in May in Oklahoma, the concern has changed to flooding.
Maybe your flood monitoring skills have gotten a little rusty. The National Weather Service and US Geological Survey work together to provide current flood information for the 48 continental US states, Alaska, and Hawaii.
One easy way to get the flood observations and forecasts is to go to Weather.gov.
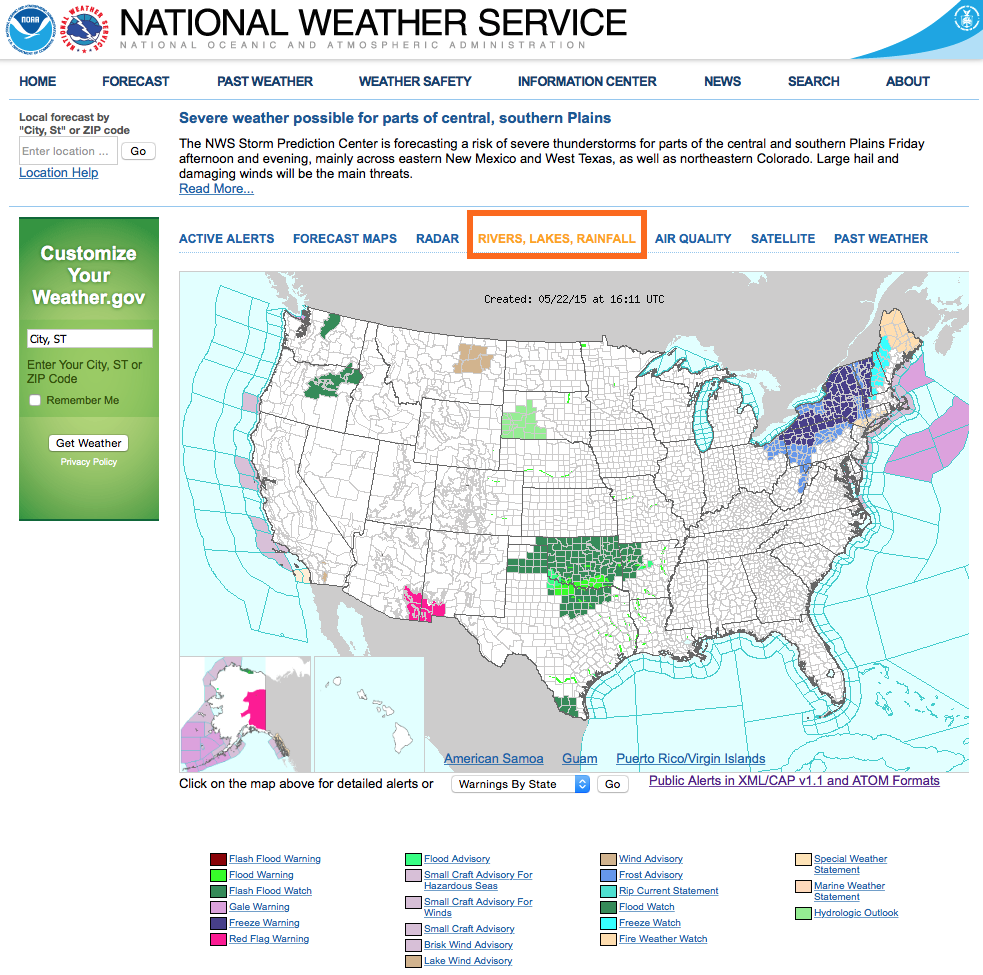
On this page select ‘Rivers, Lakes, Rainfall‘ from the menu bar just above the national map. A window with a national map will open. The map will be populated with colored circles and squares that represent individual stream gauges.
wi
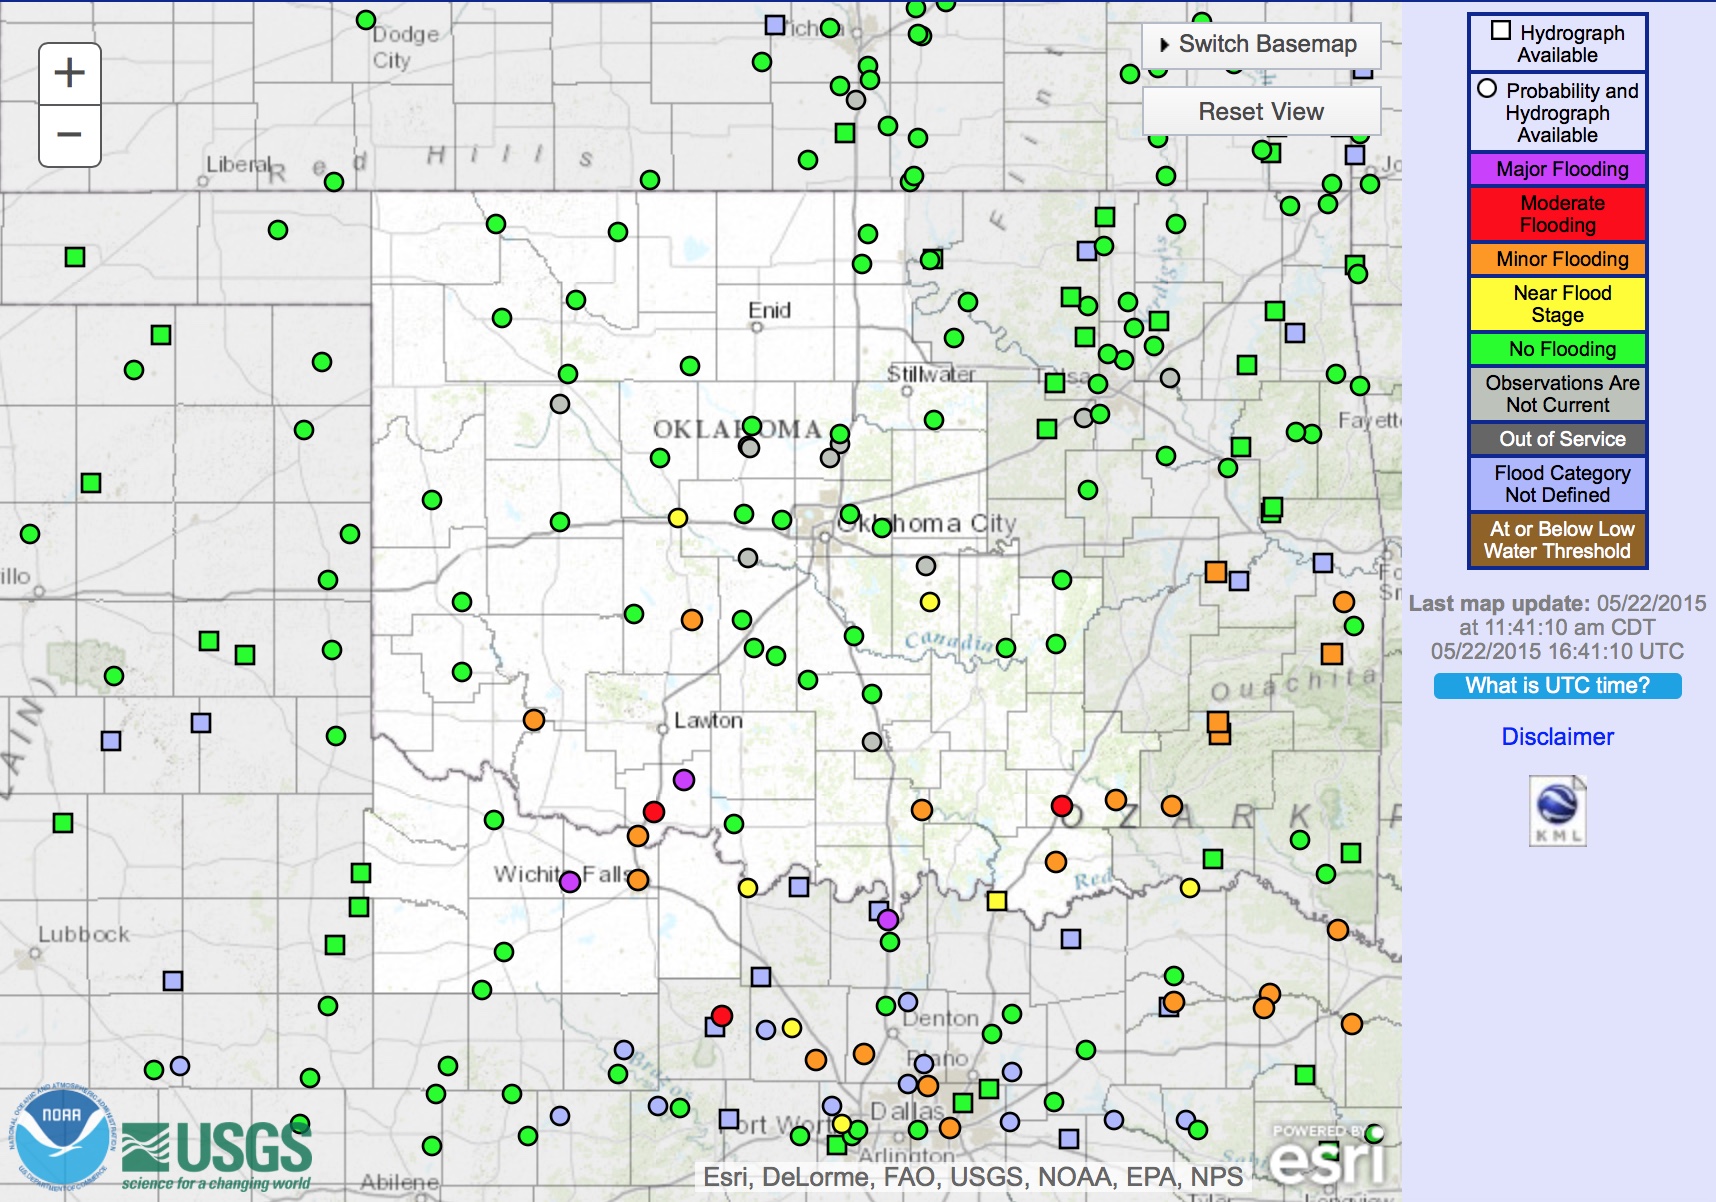
Clicking on the interactive map will zoom down to a state view. Each colored symbol represents an individual stream gauge. These are color coded to represent their flood or data status. The legend on the right lists the flood stage represented by each color. Just below the legend is a time and date stamp when the map was last updated.
Clicking on an individual stream gauge pulls up a time series graph of the stream gauge. Our example graph is for East Cache Creek near Walters, Oklahoma. The graph has color-coded stream levels by flood category: Action, Minor, Moderate, and Major. In the purple-shaded ‘Major Flooding’ graph portion, a black line and ‘Record’ feet amount is the highest recorded flood level.
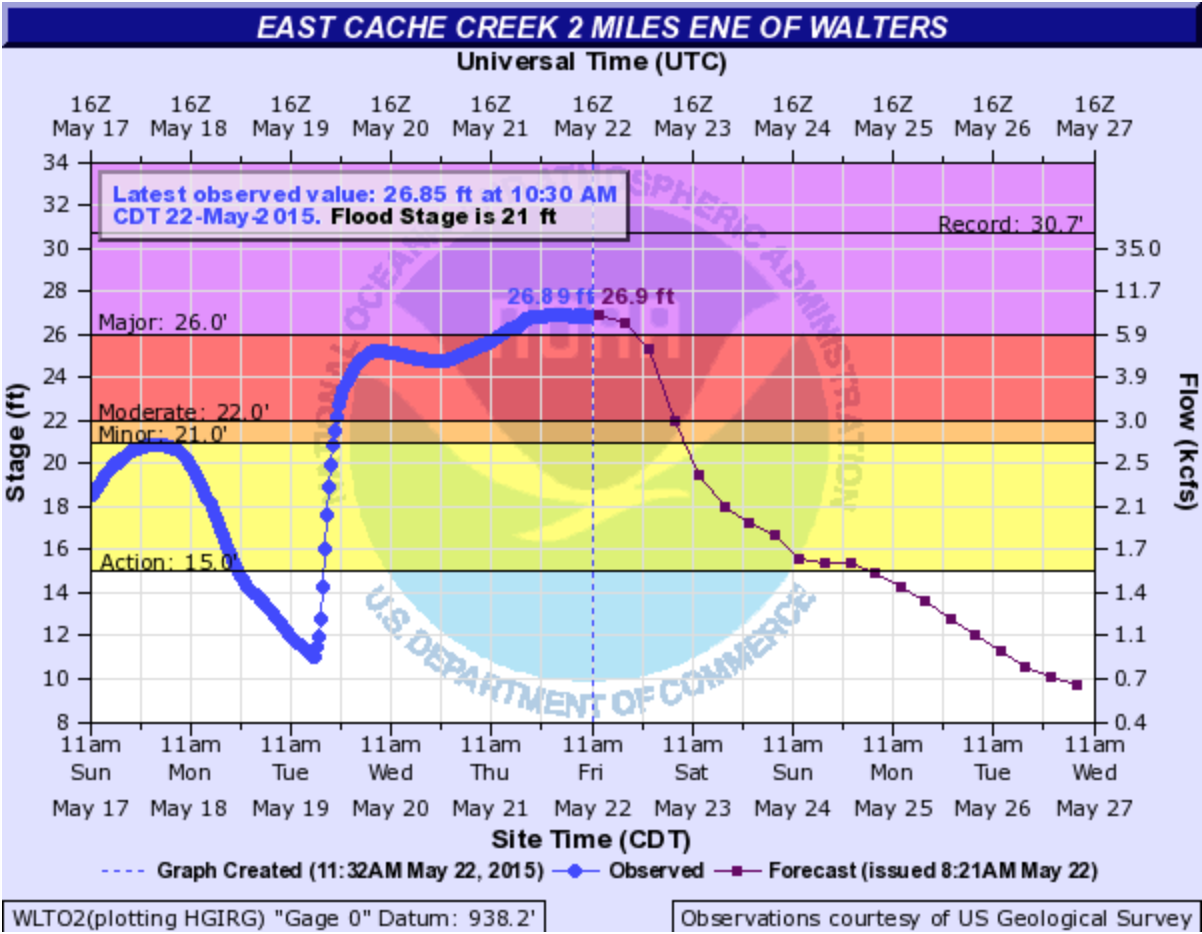
The top and bottom axes denote stream observation and forecast dates and times. The axis on the left side shows stream stage in feet. The right axis shows the stream flow in 1,000s of cubic feet per second.
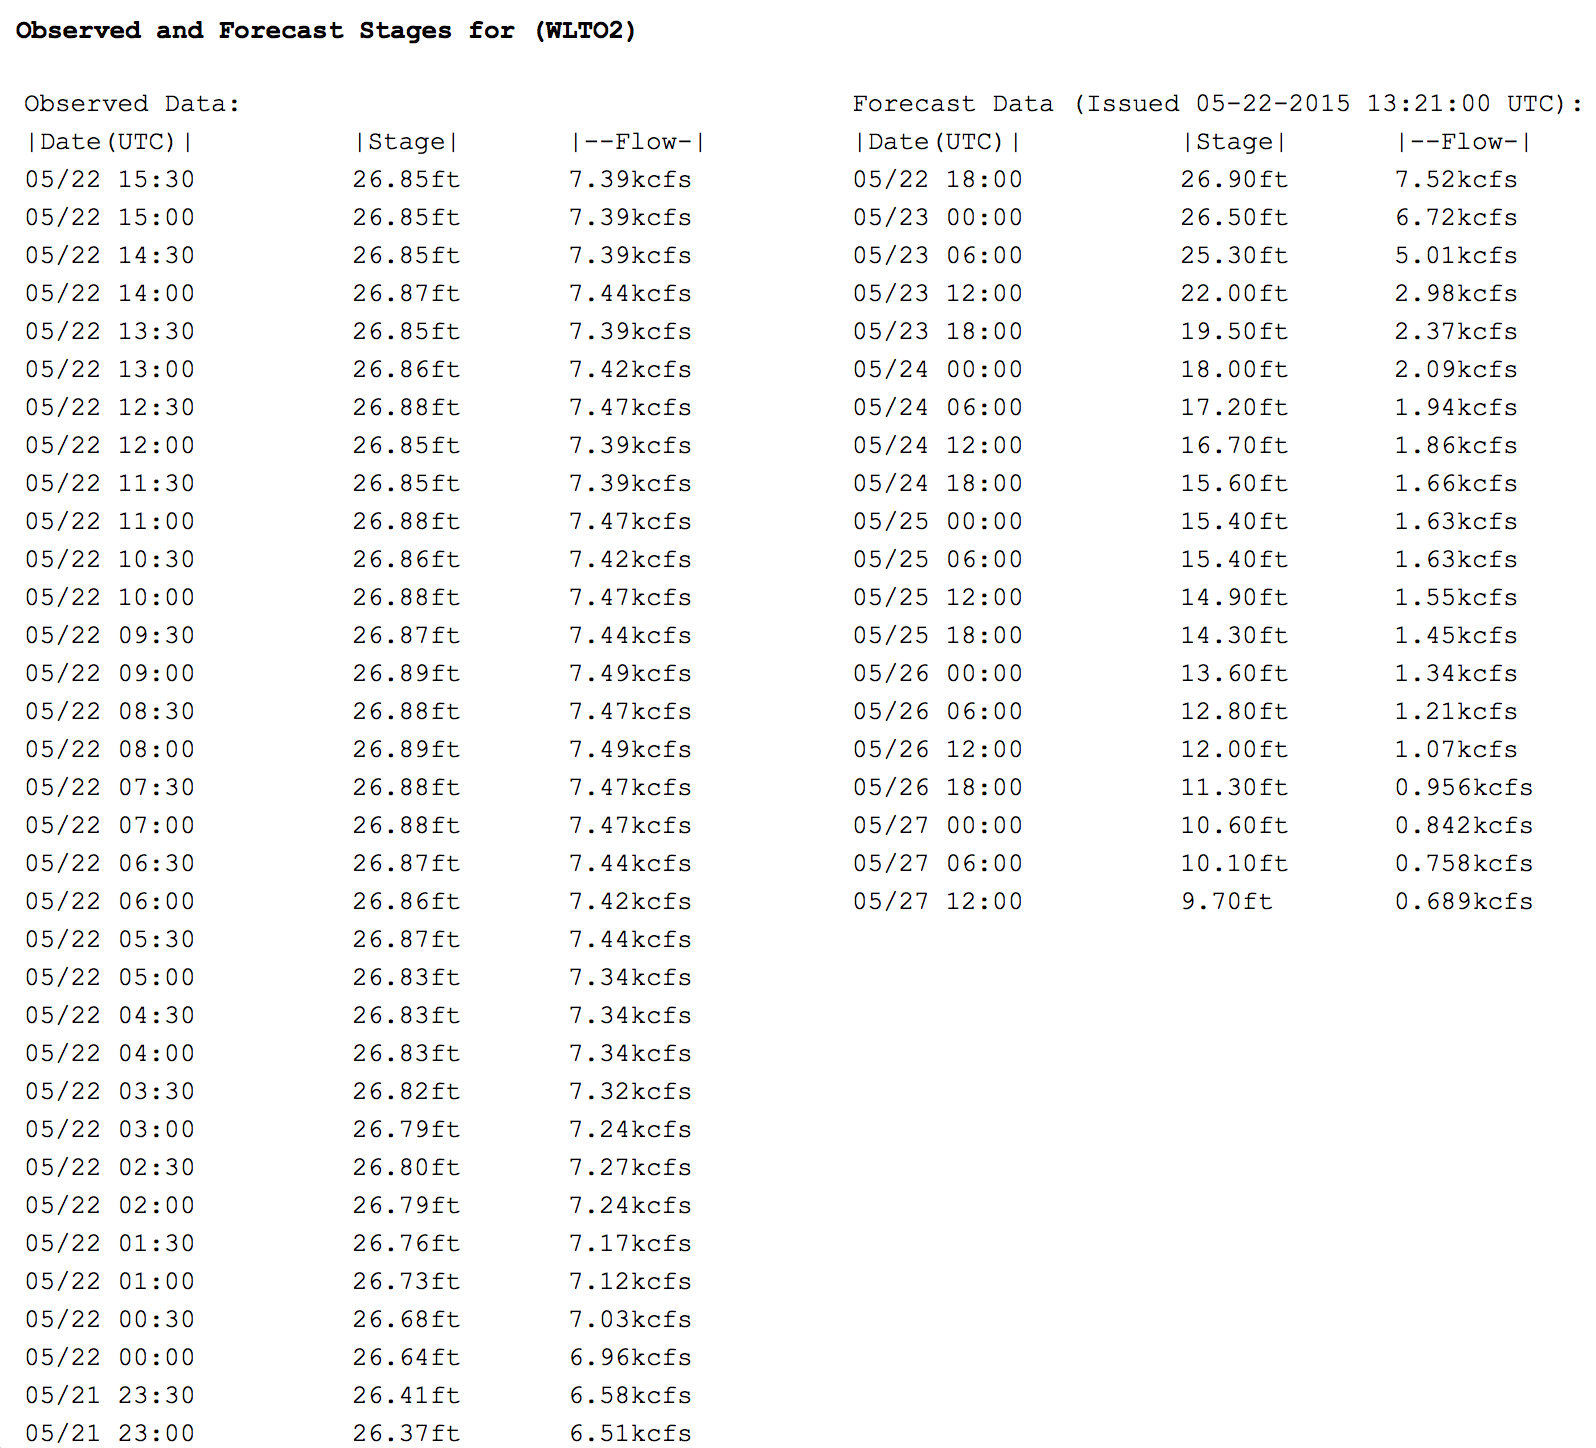
The bright blue graph diamonds are the recorded stream levels. When staked on top of each other, they form a solid line. The red-purple squares are the forecast stream levels. Clicking on the diamonds or squares will open a table of recorded and forecast stream levels and flows. The recorded data are updated every 30 minutes. The forecasted levels and flows are in 6-hour increments. Both are listed in UTC time, Universal Coordinated Time or Greenwich Mean Time. Subtract 5 hours for Central Daylight Time in the summer or 6 hours for Central Standard Time in the winter.
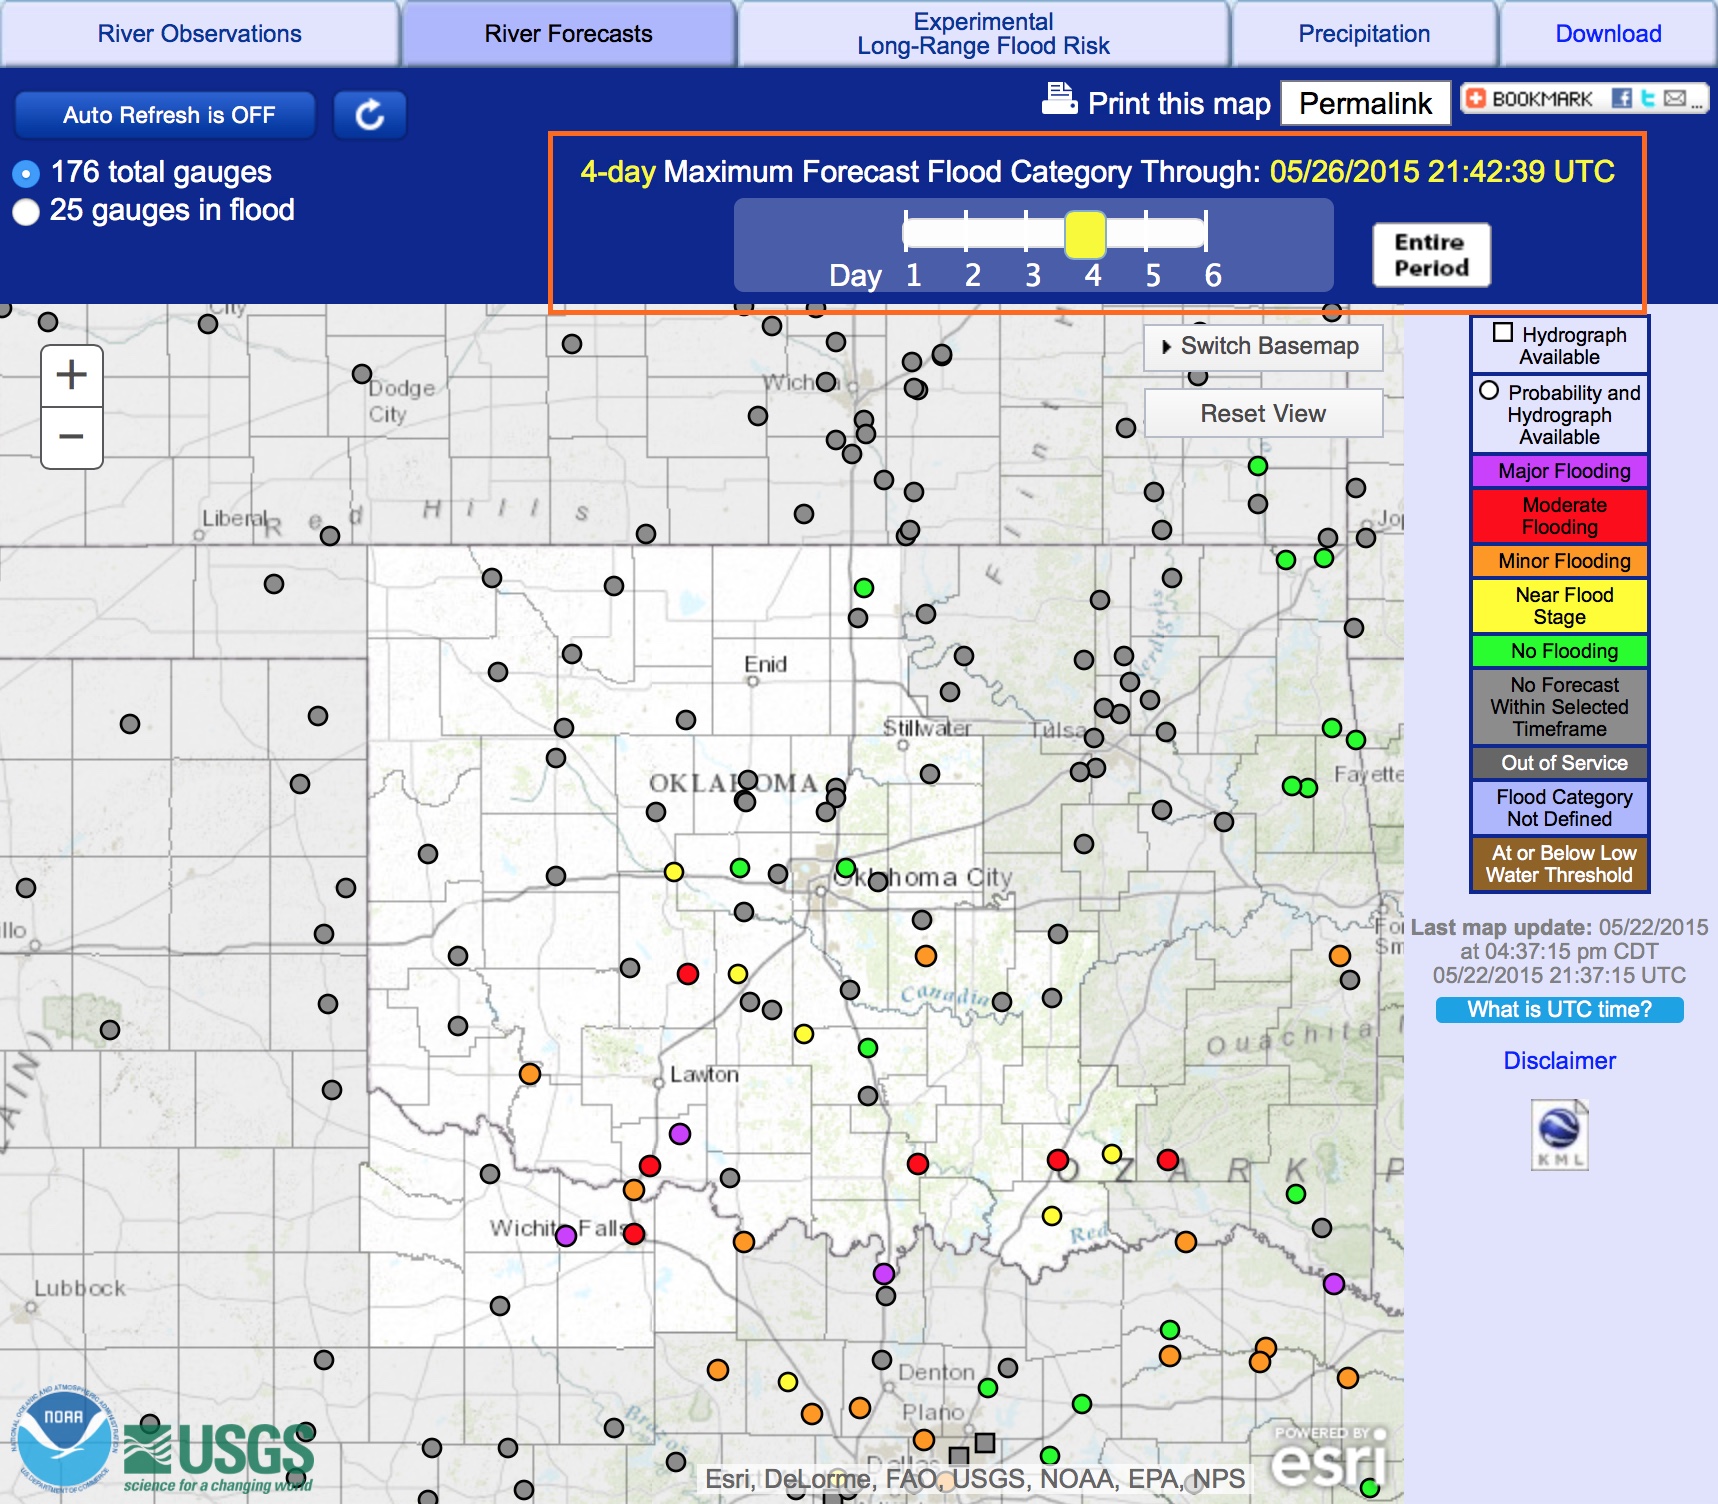
Selecting ‘River Forecasts‘ from the menu tabs above the map brings up a map with forecasted river stages and flows, where forecasts are available.
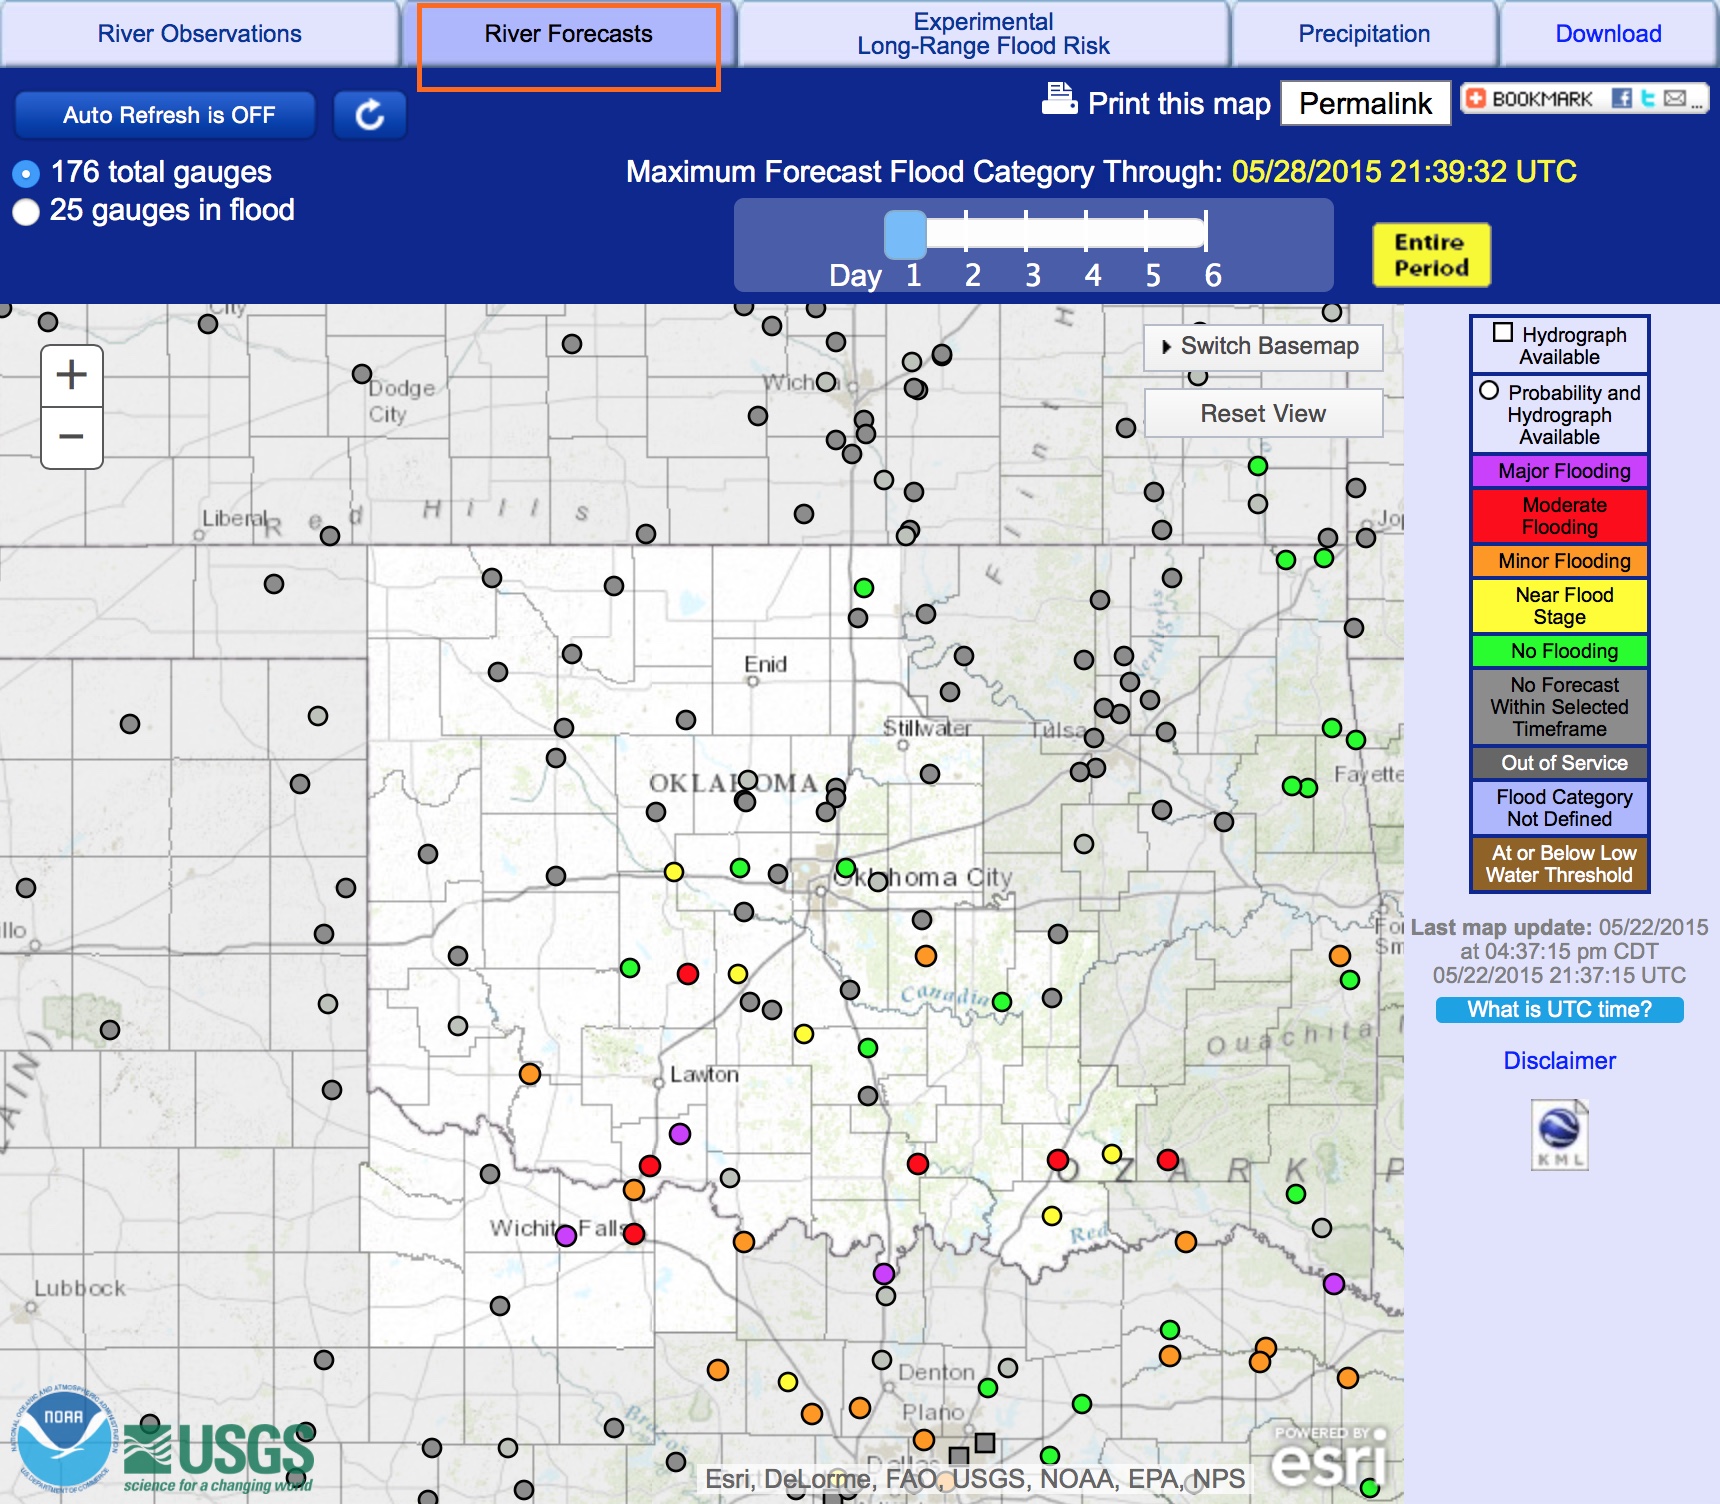
You can use the slide control to advance the maps for up to six days into the future. The slide control is not available when viewing the map of the entire nation.
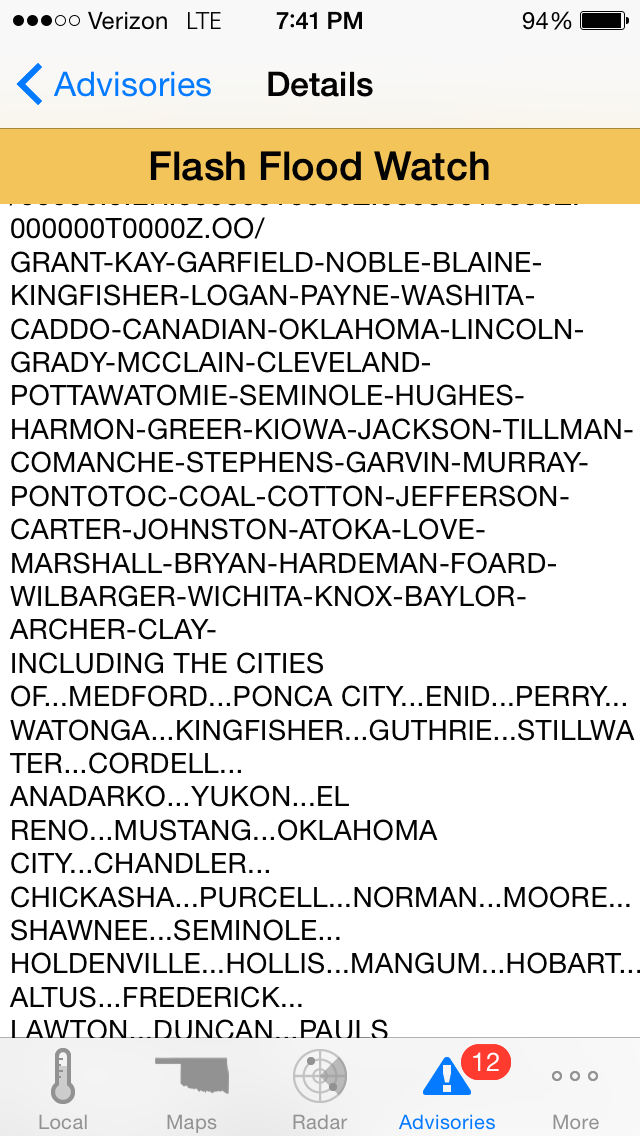
The ‘Rivers, Lakes, Rainfall‘ section is just one source of flood information. The National Weather Service issues Flood Advisories, Watches, and Warnings as needed. These will be communicated by local media, weather radio, via the Internet, and through cell phone apps. Here are two screens from the Oklahoma Mesonet iPhone app. The first lists the counties and cities the ‘Flash Flood Watch’ has been issued for.
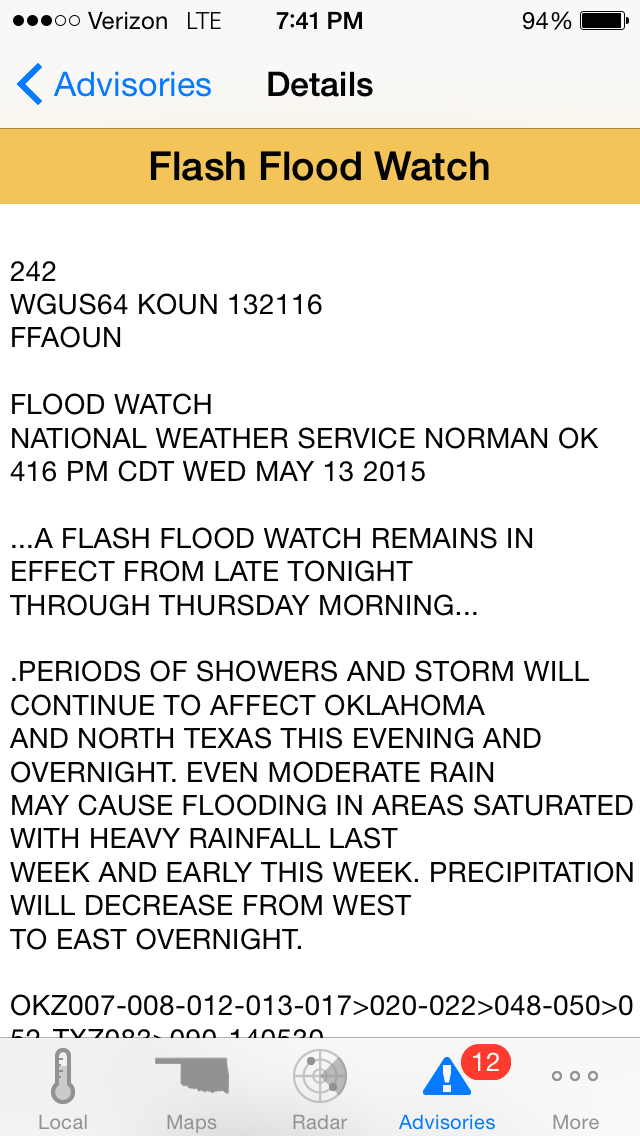
The second screen lists the time the ‘Flash Flood Watch’ was issued, the time period of impact, and the impacts expected.
The ‘Rivers, Lakes, Rainfall‘ interactive map and graphs are a great team effort between the meteorologists at the National Weather Service, part of the National Oceanic and Atmospheric Administration, and hydrologists at the United States Geological Survey, part of the U.S. Department of the Interior, to provide river level conditions and forecasts.