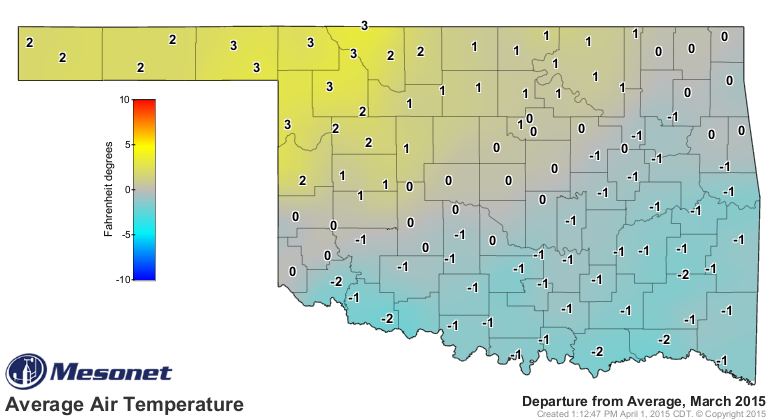
March is a critical month in Oklahoma. It is the month when wheat and canola come out of dormancy. It’s the month when the risk of wildfires is highest (Weir, Reid, & Fuhlendorf, 2012). Temperatures and moisture in March set the tone for our crops and rangeland. March was cooler and wetter in the east, southeast, and south central regions. It was warmer and dryer in the Panhandle, west, and north central areas. Interstate-44 was the approximate dividing line. The following map shows the departure in average temperatures for March 2015 from Oklahoma Mesonet’s long-term 15-year averages (1990 to 2014).
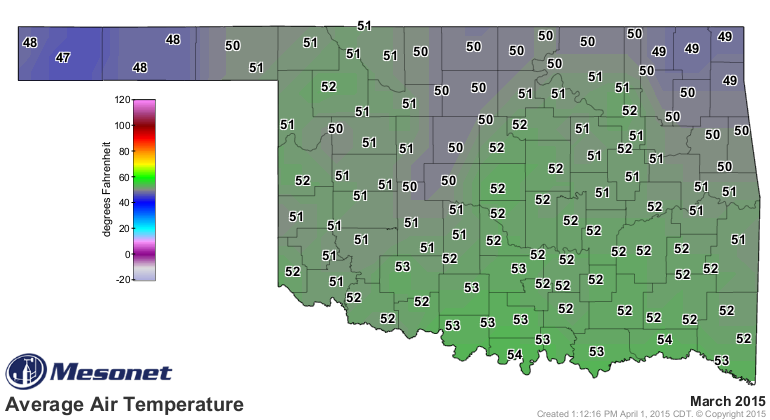
Here were the March 2015 air temperature averages across Oklahoma. If temperatures were closer to average for the month, the range in temperatures would have been wider.
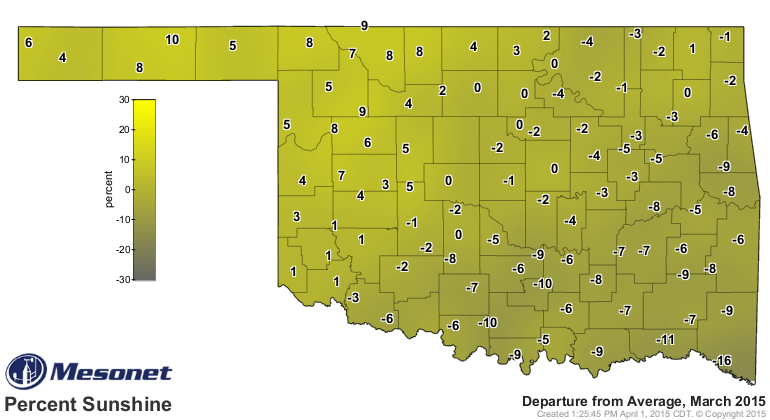
Sunlight helped drive the warmer and cooler air tempertures. The departure in percent sunshine for March followed the pattern of departure in temperature. The range went from 10% above average at Hooker, in the Panhandle, to 16% below average at Idabel, in the southeast.
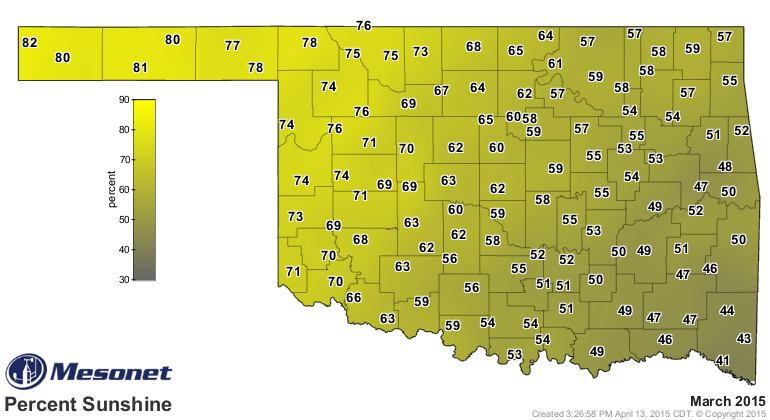
The percent sunshine ranged from a high of 82% at Kenton to a low of 41% at Idabel.
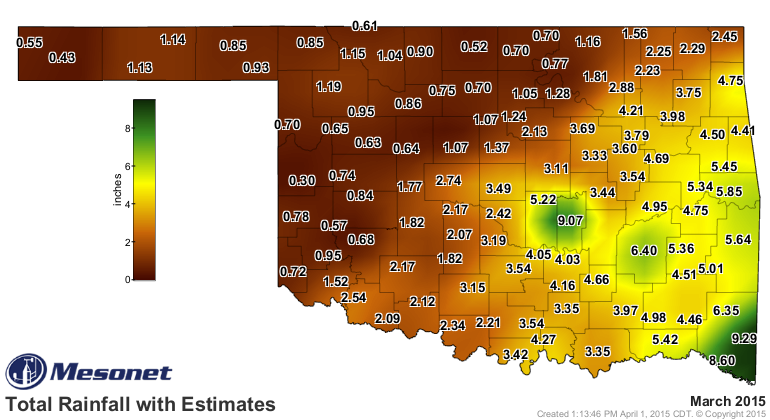
The split in rainfall tracked the state splits in March air temperature and percent sunshine. To the north and west of I-44, below average rainfall amounts. To the east and south of I-44 above average rainfall, with higher amounts at Bowlegs and Idabel.

Total rainfall amounts ranged from less than an inch in the Panhandle, northwest, west, and north central areas to closer to six inches in east central and southeastern locations. Bowlegs and Broken Bow collected more than nine inches, while Idabel fell just below that with 8.6 inches. Bowlegs received 5.36 inches on March 31st. Broken Bow’s high rain day was March 13th, when 2.44 inches was collected.
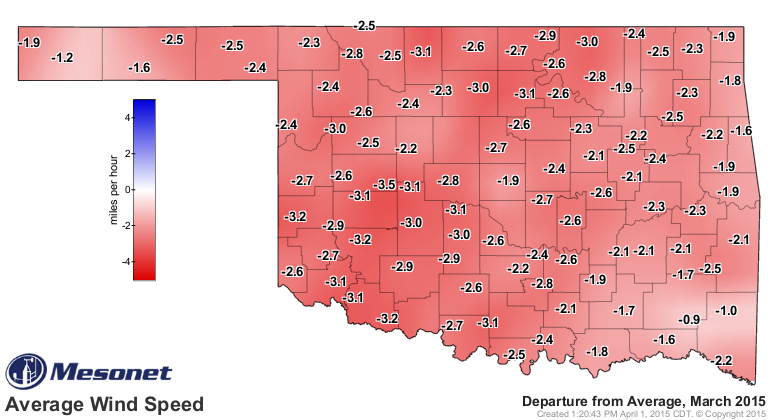
One weather variable with a fairly consistent pattern across Oklahoma in March was wind speed. Wind speeds came in 2-3 miles below average for the majority of Oklahoma Mesonet locations.
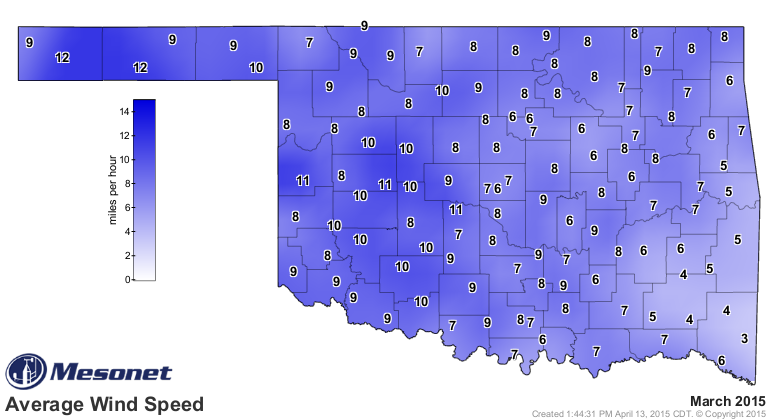
The average wind speeds for March ranged from a low of 3 miles per hour at Broken Bow to a high of 12 miles per hour at Boise City and Goodwell. Winds speeds at Cheyenne, Weatherford and Minco, at 11 miles per hour, were just under Boise City and Goodwell.
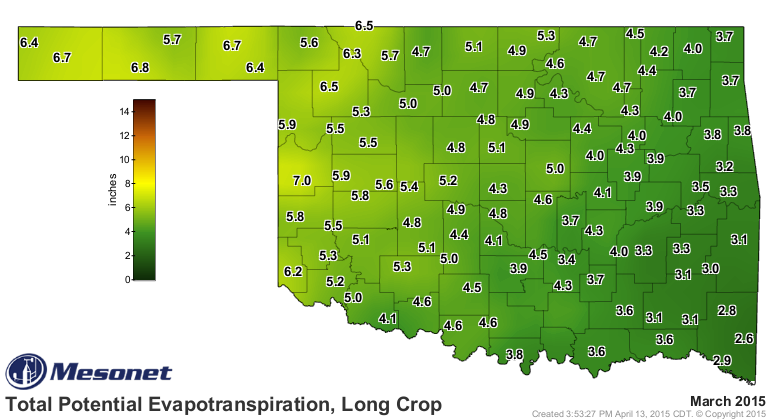
The lower wind speeds helped hold down potential evapotranspiration for the month, even in the areas with above average air temperatures and percent sunshine. Only May Ranch was above average, 0.3 of an inch. Nearby Mesonet sites at Buffalo and Freedom were right at average, 0.0 departure. Grandfield was 2.5 inches below average for March.

Oklahoma Mesonet Total Potential Evapotranspiration, Long Crop values are estimated inches of water use by plants and water loss by evaporation from the soil surface. Values are calculated from the ASCE Standardized Reference Evapotranspiration formula. Long crop evaporation values provide an estimate of winter crop water demand. Long Crop Potential Evapotranspiration ranged from 2.6 inches at Broken Bow to 6.8 inches at Goodwell. The Reference Evapotranspiration formula calculates a maximum crop water use estimate. There is no adjustment for lower water demand from crop water stress.
That’s a look at the month of March 2015 in maps. Maps that monitor the weather variables that drive winter crop production. You can make your own weather maps by going to the Oklahoma Mesonet Long-Term Averages – Maps tool. You can create your own statewide map of any of the sixty-three data averages or departure from average for any month between 2000 and 2015. The 15-year averages are calculated from Oklahoma Mesonet data from 2000-2014.
REFERENCES:
Allen, R.G., I.A. Walter, R.L. Elliott, T.A. Howell, D. Itenfisu, M.E. Jensen, and R.L. Snyder. 2005. The ASCE Standardized Reference Evapotranspiration Equation. ASCE Environmental and Water Resources Institute January 2005 Final Report.
Weir, J.R., A.M. Reid and S.D. Fuhlendorf. 2012. Wildfires in Oklahoma, OSU Fact Sheet NREM-2888-4.
I loved living in Oklahoma from 2013 to 2014. I actually appreciated the humidity and the heat. I come from a very cold environment and so when it got cold there I was okay with that but I really enjoyed the heat. One thing that I didn’t enjoy that much, however, was the taste of the water, especially in Norman. The water in Stillwater was okay. I lived in each city for nine months each. Anyways, in Norman I always had to use a pure water filter for my water. I felt sick anytime I drank it unfiltered. I know that the water comes from the lake but is the quality of the water affected by the heat and the humidity?
The flavor of the water has more to do with the minerals so common in Oklahoma water sources. Lots of calcium, magnesium, and iron.