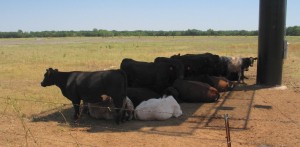
We don’t seem to slide into summer heat in Oklahoma. Instead, summer arrives with searing heat, days after it was cool enough to grab a sweatshirt. Now that we’ve recovered from the shock of summer’s arrival, this would be a good time to take notes on how the heat impacted your cattle. Did your animals suffer from the heat? Did you note any times of unusual behavior?
In Oklahoma, you have the Mesonet Cattle Comfort Advisor that charts daytime heat and nighttime cooling. By matching up the Cattle Comfort index values to your cattle’s behavior, you can develop heat stress thresholds unique for your location and animals from your nearest Oklahoma Mesonet site.
What are you looking for in your cattle? Here are some progressive cattle heat stress symptoms from the USDA Agricultural Research Service.
- Elevated breathing rate
- Restless
- More time spent standing
- Drooling
- Cattle group together
- Open mouth breathing
What are you looking for in the Mesonet Cattle Comfort Advisor?
- Daytime index values above 105
- Nighttime index values above 75
- Multiple days when index values go above 105 in the day and stay above 75 at night
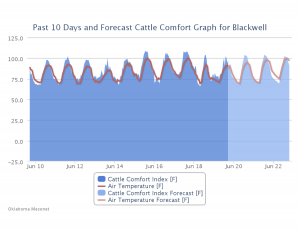
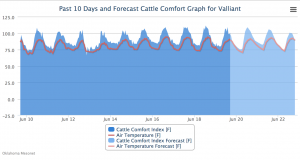
Mesonet Cattle Comfort 10-Day and Forecast graphs for Valliant and Blackwell demonstrate what we want in nighttime cooling that allow cattle to dissipate heat from hot days and digestion. At both sites, the daytime Cattle Comfort maximums were similar for the three days, June 15-17, 2016, above 105. At Blackwell, one night out of ten did not get to 75 or lower at sometime during the night, dark blue fill.
At Valliant, eight out of ten nights were above 75 and most were close to 80 for a minimum Cattle Comfort index value. Those warm nights in succession won’t let cattle recover from the hot days. How will cattle cope? They’ll need shade or a pond they can use to get cooler during the day.
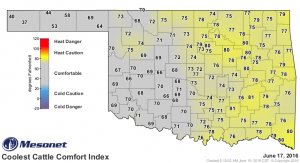
If you want to check on the minimum over a region or the whole state, you can pull up a map of the Coolest Cattle Comfort Index for yesterday or two days ago. On the map for June 17, 2016, it’s easy to see the warmer nighttime cattle comfort index values in the east. The yellow areas indicate locations that didn’t go below seventy-five.
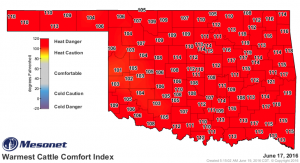
And here is the daytime Warmest Cattle Comfort Index, that followed our map above of nighttime lows.
Only ten sites came in below 105 on June 17, 2016. And over at Stigler, the Cattle Comfort index hit 121. Obviously, June 17th was not a comfortable day for Oklahoma’s cattle.
