What gambles do farmers take? They gamble on when and how much it will rain. They play the odds. If I put down some fertilizer, will it rain enough to move it into the soil? Will rain fall in time for my planted seed to come up? Will the next forecasted rain be enough to incorporate this herbicide?
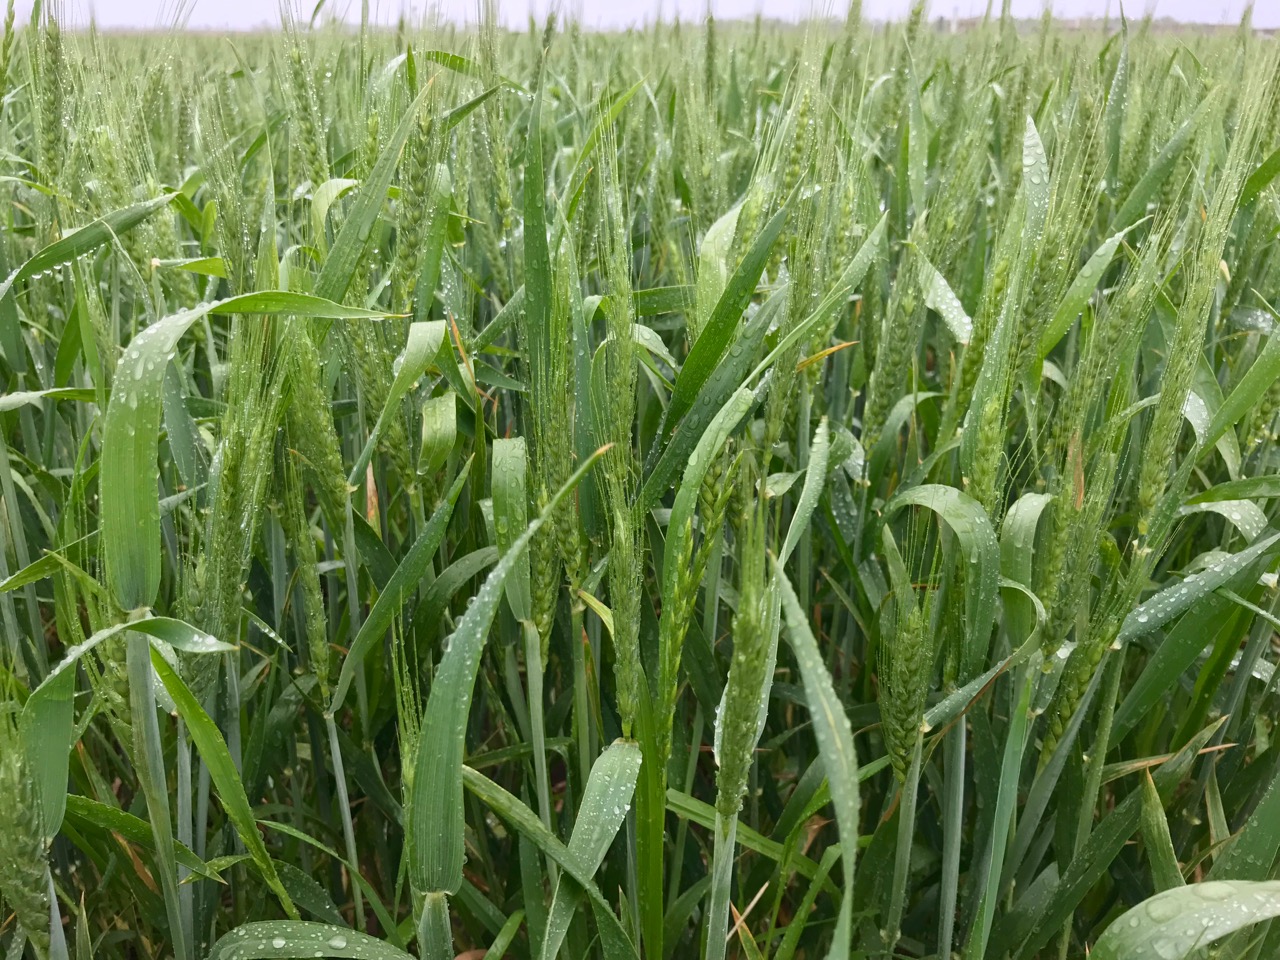
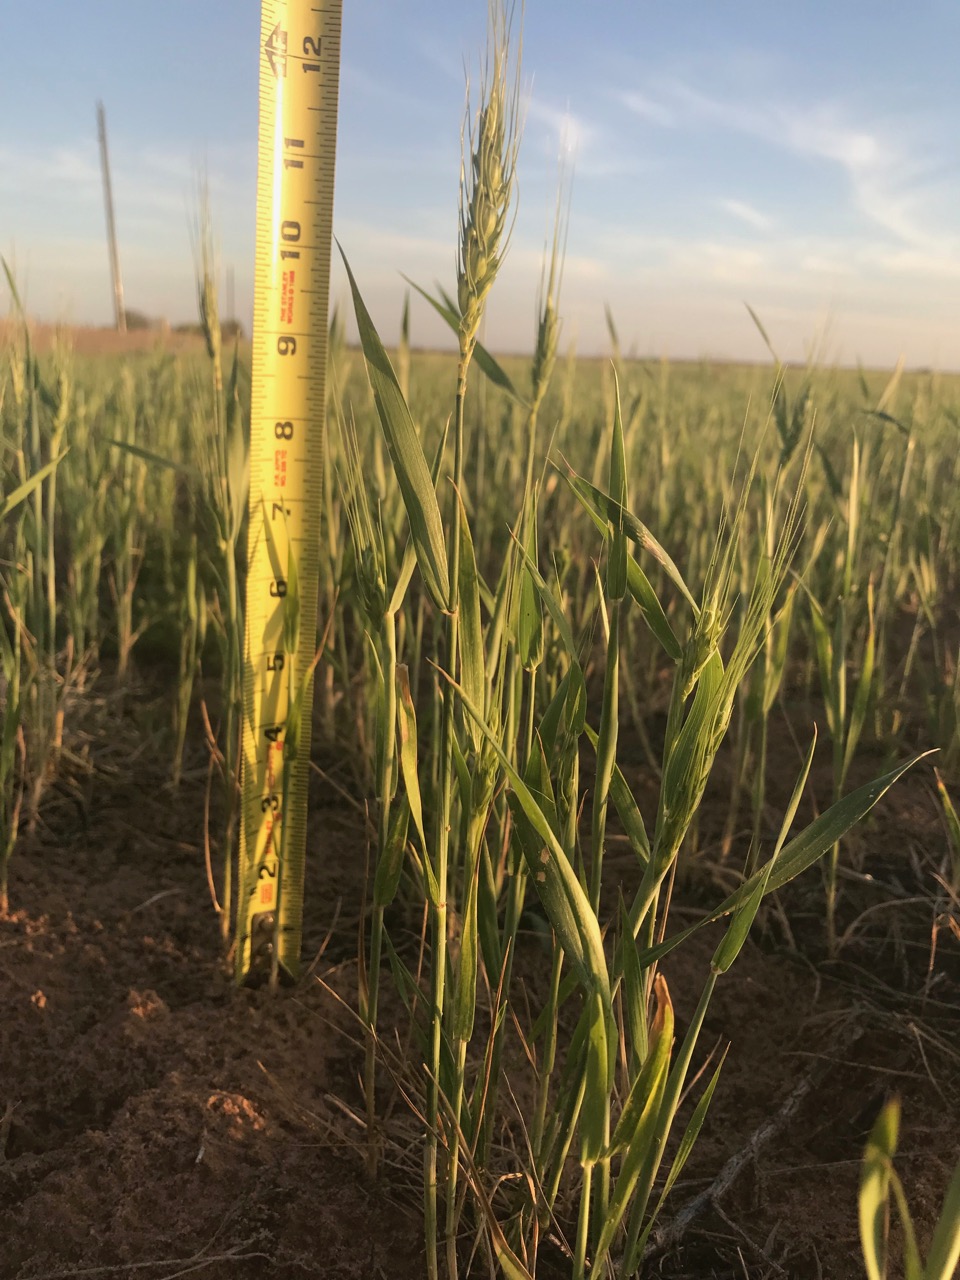
Photos: Left, headed wheat east of Chickasha 04/25/18 (A. Sutherland). Right, headed wheat north of Duke 04/27/18 (K. Johnson).
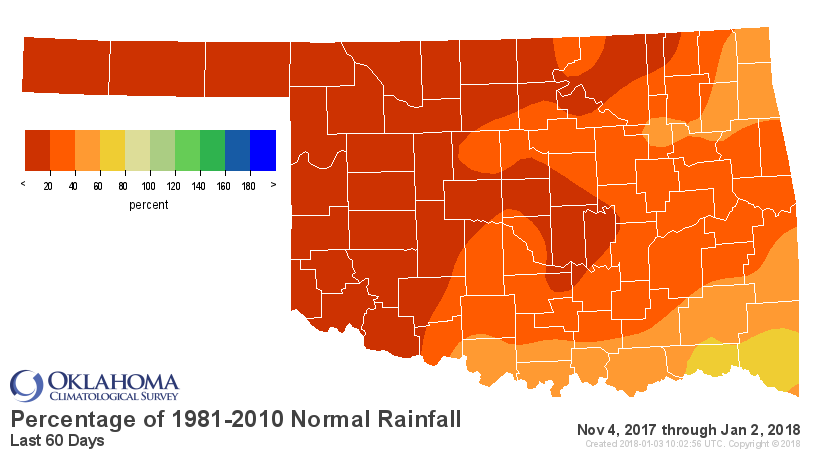
The rain gamble is different for every farmer, for every crop. As we finished out 2017 in Oklahoma, rain was elusive. Even frozen precipitation held back this winter. A percent of normal rainfall map for most of November and all of December, points out how every Oklahoma farmer was below their normal rainfall at the end of 2017. It was driest in western Oklahoma. Red map areas received less than twenty percent of their normal rainfall.
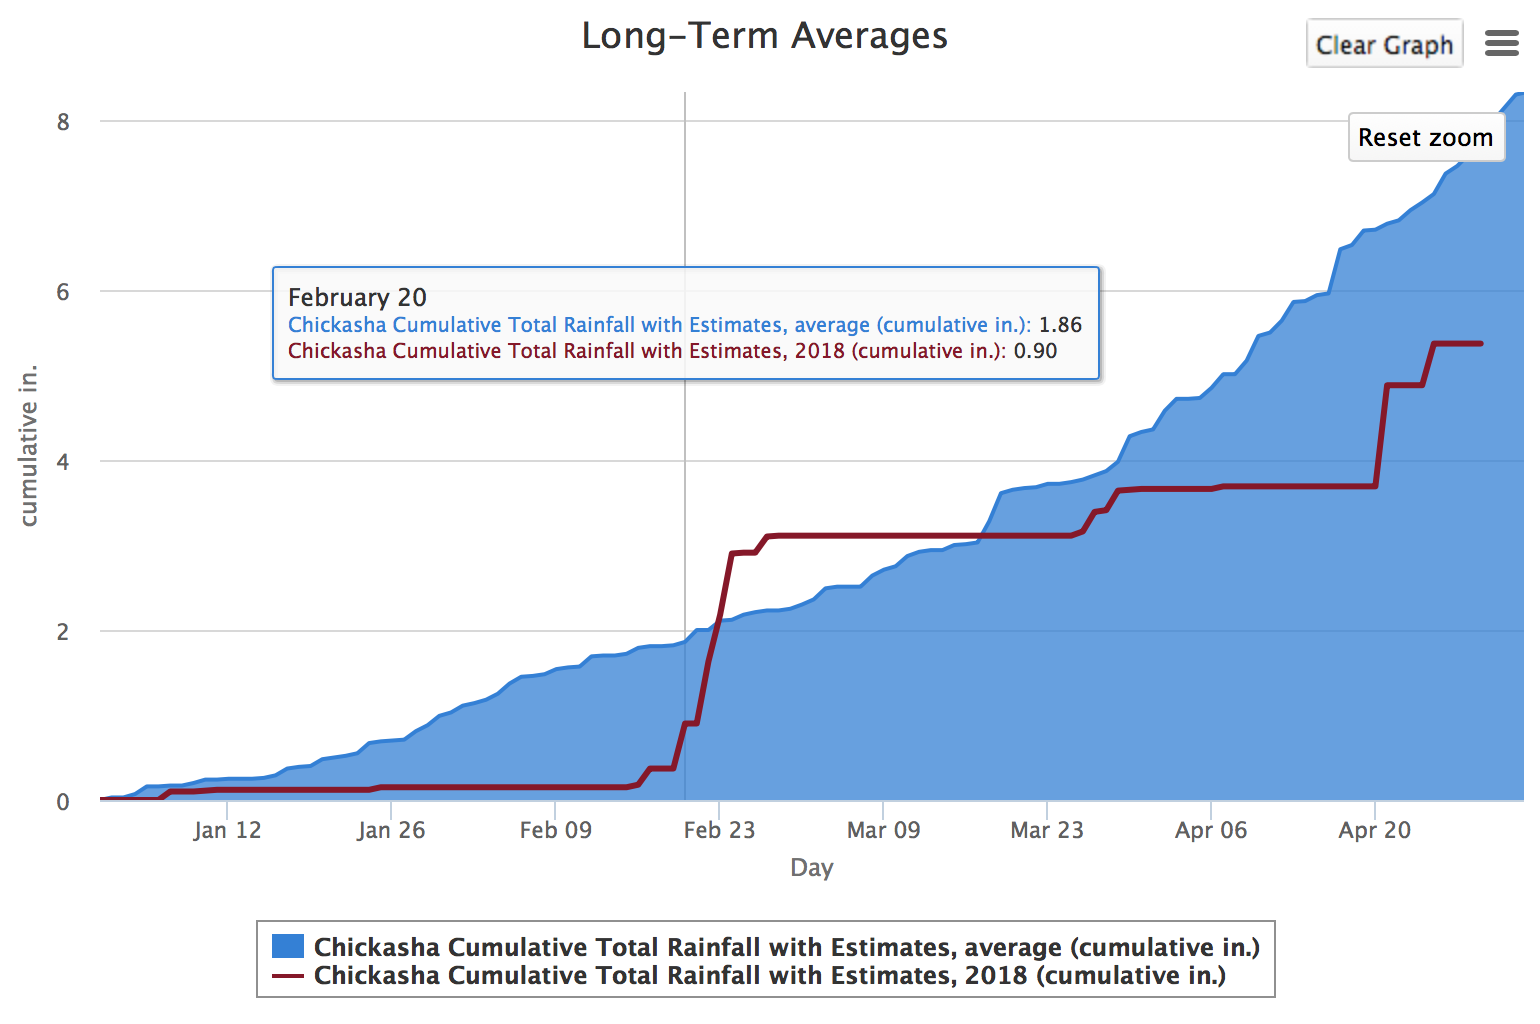
So farmers were anxious about when the first good rain would fall in 2018. A rain data graph from the Oklahoma Mesonet shows the first good rain at Chickasha fell on February 20th. Rain continued for a number of days, so by February 27th rainfall at Chickasha for 2018 had climbed to 3.1 inches. That put farmers near Chickasha above average before March arrived.
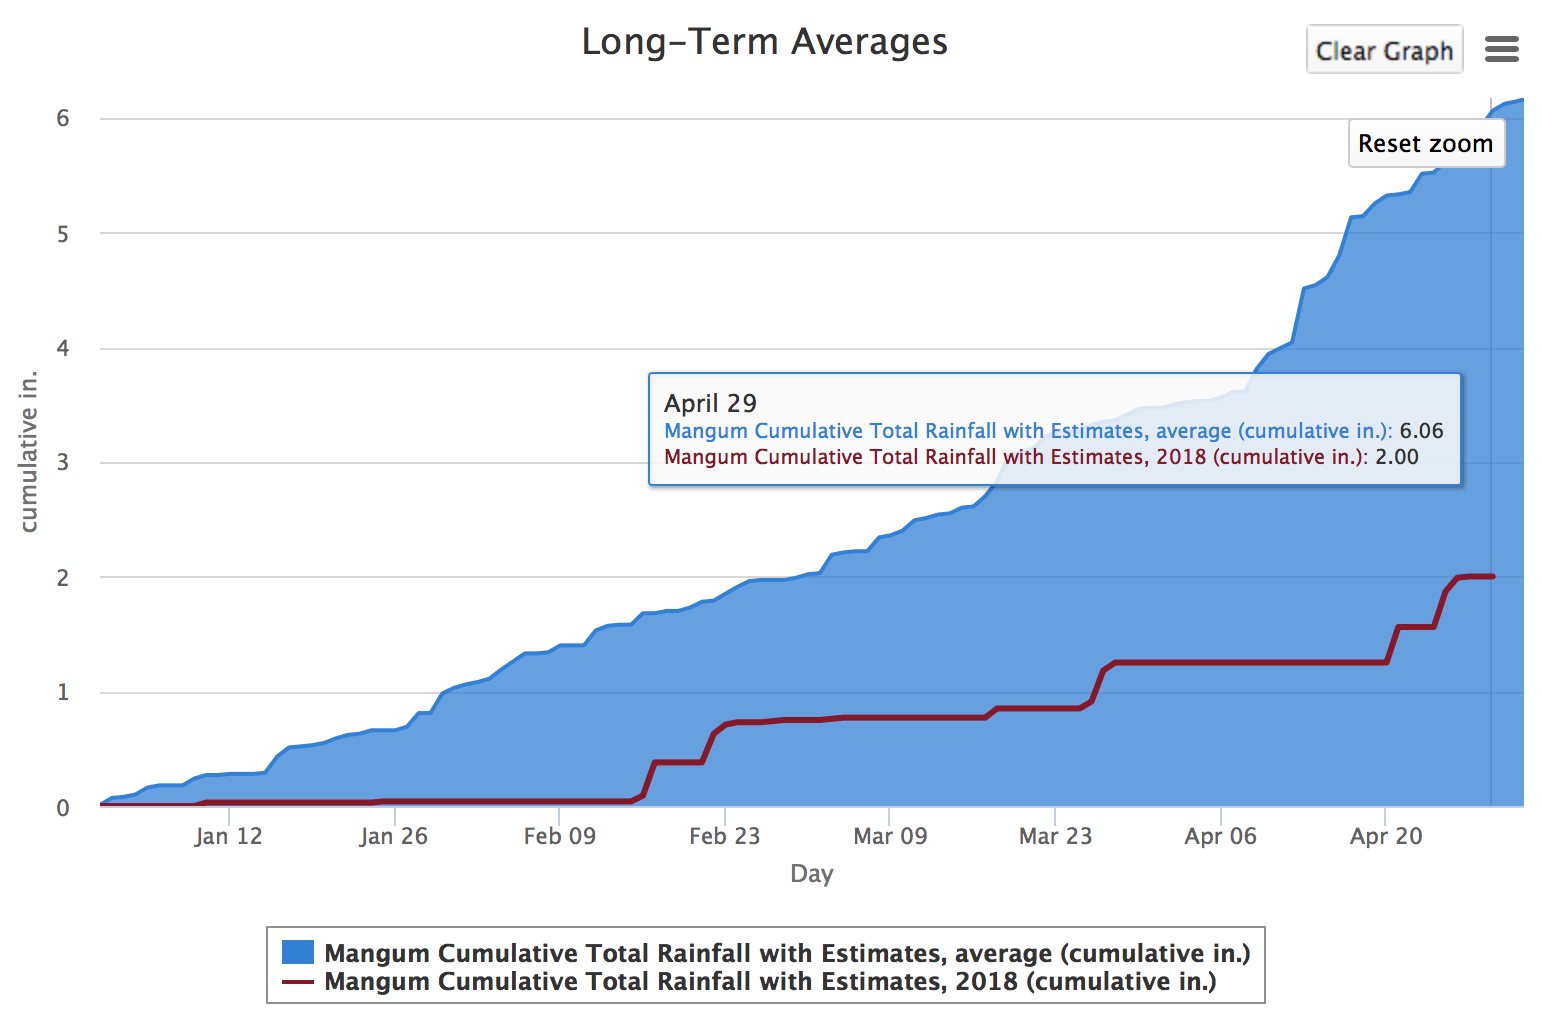
Out in western Oklahoma, the lack of rain has been extreme. At Mangum, in Greer County, less than three-quarters of an inch fell in February. With little drips and dabs, rainfall finally reached two inches by the end of April. But that was 4 inches below Mangum’s long-term average of 6 inches collected by the end of April.
The rainfall differences between Chickasha and Mangum produced the huge differences in the two wheat crops pictured above.
Farmers start another round in the rain gamble game every time they plant a crop.
The Mesonet Long-Term Averages Graphs are updated daily. You can choose from pre-made graphs or use the “Add customized data” tool to build a custom graph. Mesonet has 120 sites and over 60 different data sets. Want to see a state-wide view? Check out the Mesonet Long-Term Averages Maps tool.