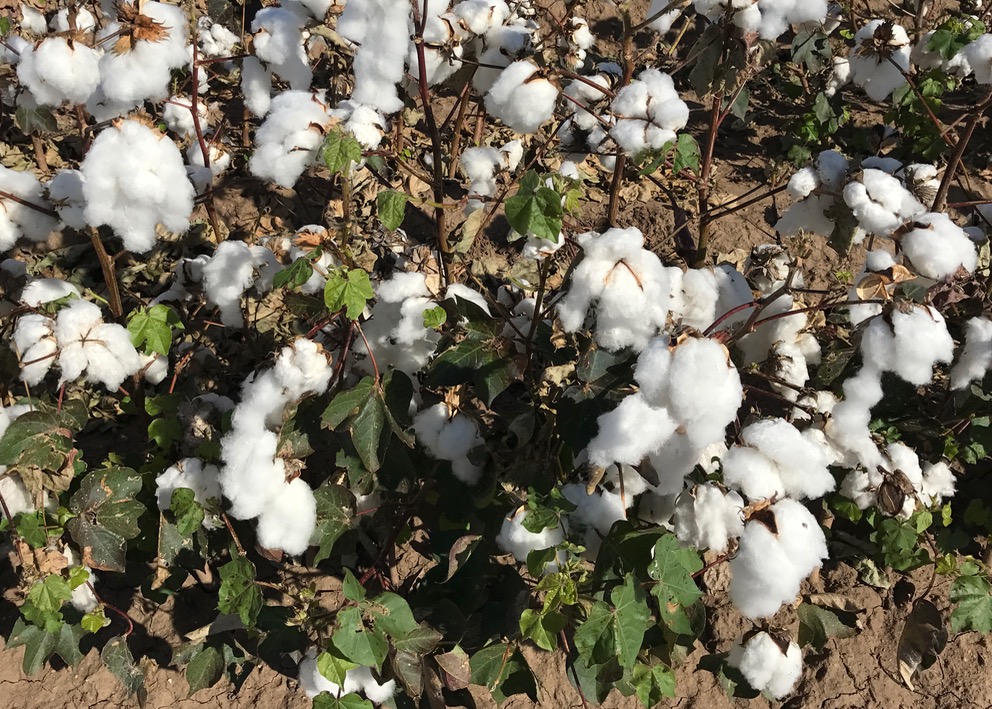
Friday morning has arrived and so has another rainy August day in Oklahoma. All the rainy days this August has meant more cooler days. Those cooler August days have left cotton farmers wondering if they’ll have enough heat units to fully mature this year’s crop.
One of the ways to track a crop’s daily and accumulated heat units is with the Oklahoma Mesonet Degree-day Heat Unit Calculator. This tool allows you to enter a crop planting date and get a table of heat units for any Mesonet site. The table shows daily heat units from planting to the most current date and the accumulation of those heat units over the season.
To get a feel for the 2017 cotton crop environment, here are some heat unit statistics for Altus, Elk City, and Weatherford comparing 2016 and 2017. The column that may be the most important is the last column. This shows how much the heat units in 2017 were behind 2016. A cotton planting date of May 25th was used for both years and each location.
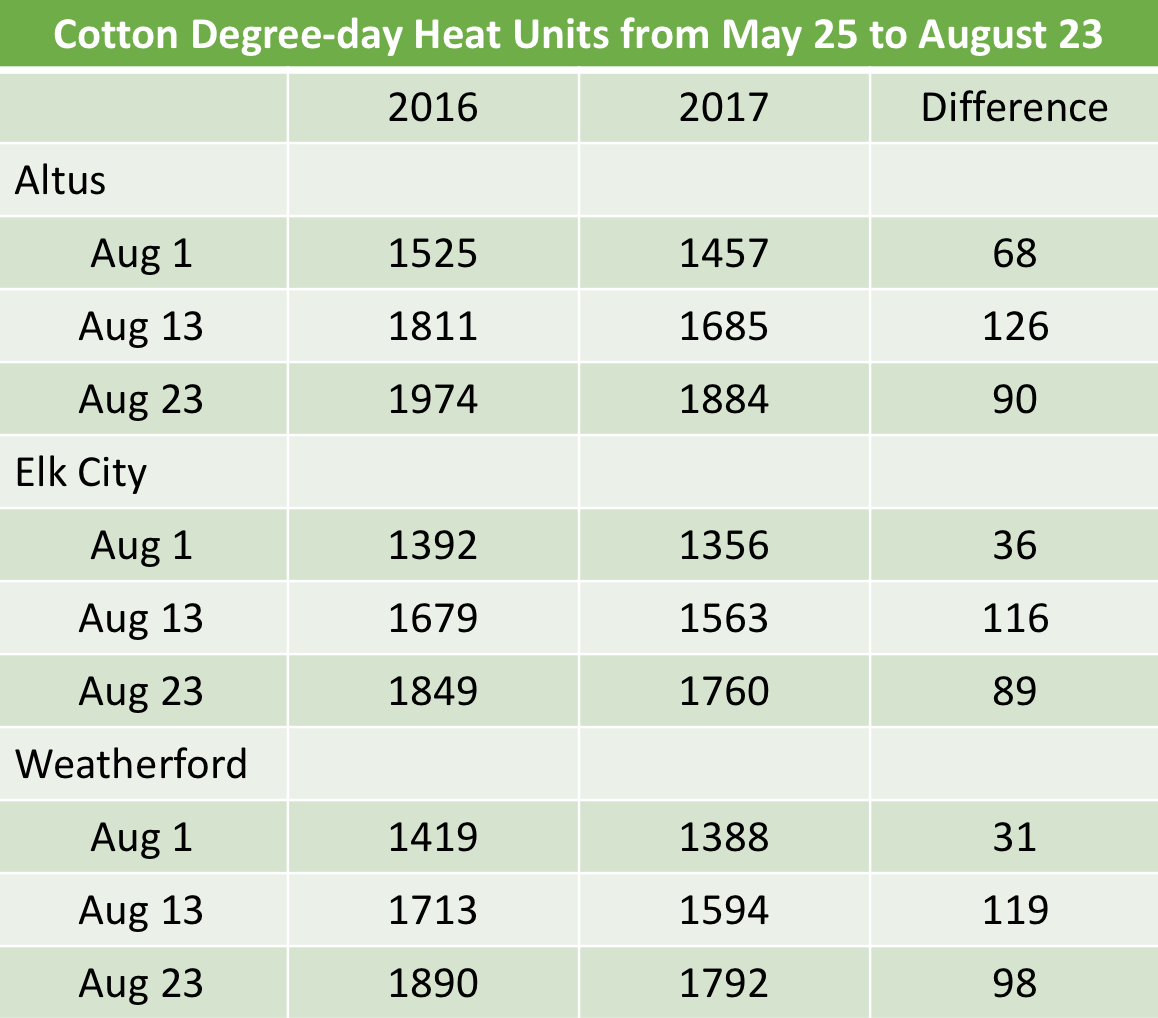
August 13th was the date with the largest gap in heat units between 2016 and 2017 at Altus, Elk City, and Weatherford. All three sites had less heat units in 2017. Altus was behind by 126 degree-day heat units. Elk City was behind by 116 on that date and Weatherford behind by 119. But after August 13th, the gap for Altus narrowed to 90 heat units by August 23rd. Elk City was behind by 89 heat units on August 23rd and Weatherford 98 heat units behind.
For the total heat unit accumulation from a planting date of May 25th to August 23 in 2017, Altus had the most at 1,884. Elk City was the lowest at 1,760. Weatherford had 1,792.
Considering Altus’ higher heat unit accumulation and how much ground Altus gained in heat units from August 13th to 23rd this season, it looks like cotton crops around Altus are at less risk of not reaching full maturity.
Fields around Elk City and Weatherford appear to be at a higher risk for collecting enough heat units, especially if planted on the late side.
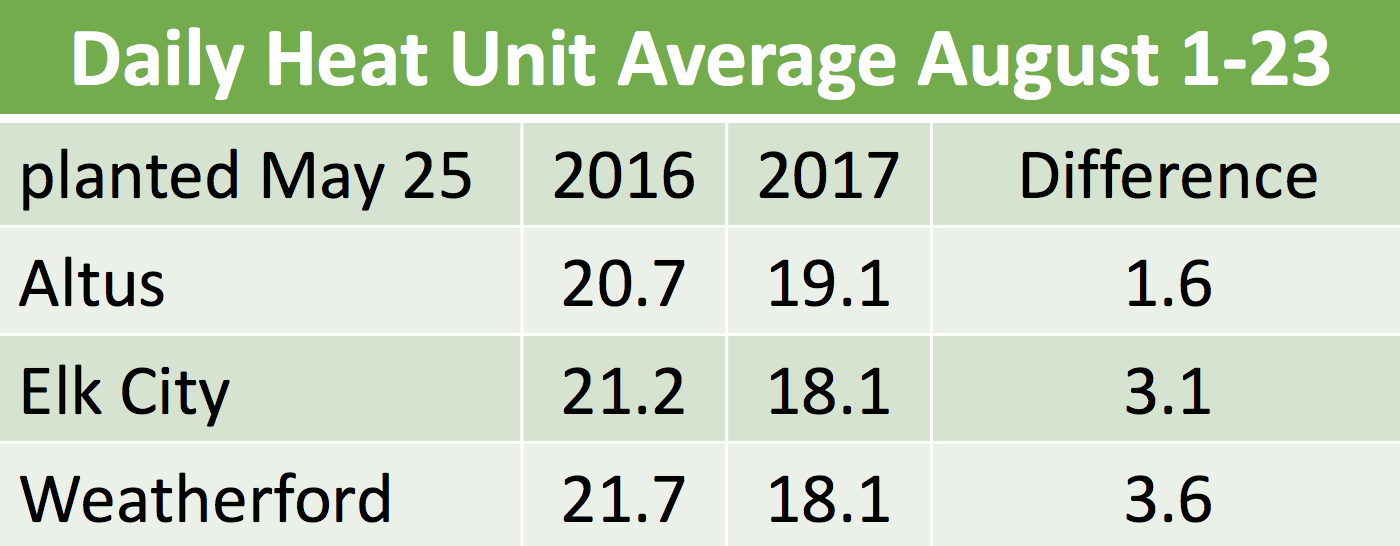
Here is another chart with daily cotton degree-day heat unit averages for Altus, Elk City, and Weatherford from August 1st to 23rd. Altus was behind by a daily average of 1.6 heat units per day in 2017. The daily average for Elk City was 3.1 heat units short. Weatherford’s daily average was behind by 3.6.
That makes it more important for September and October to be above average in temperature for crops in the Elk City and Weatherford area and less critical for those in and around Altus.
So what is the likelihood that September and October 2017 will provide enough heat units to mature a cotton crop?
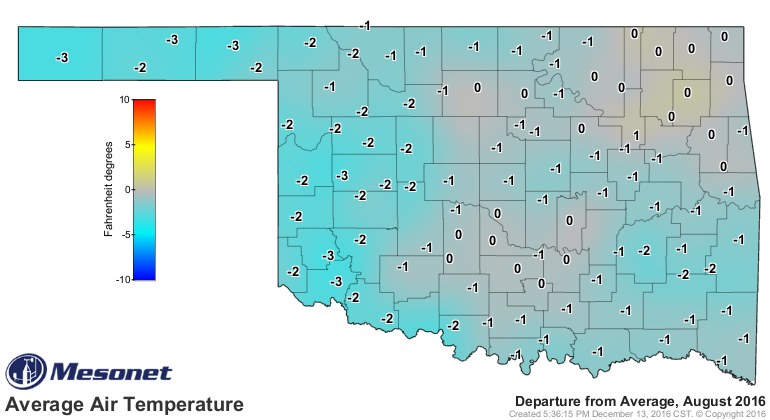
One note of hope is that last year August was cooler than average. In 2016, Altus was 3 degrees cooler than its 15-year long term average. Weatherford was 2 degrees cooler. Elk City has not been operational long enough for a long-term average. So we had a cooler August in 2016, similar to what we have seen so far this year.
September came in close to average for Altus and Weatherford.

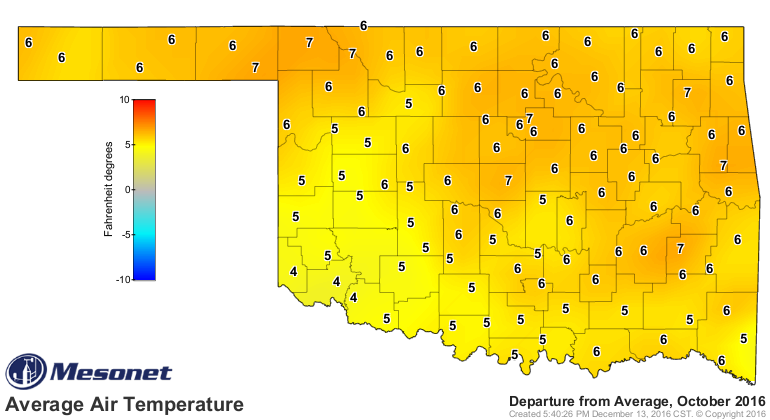
October 2016 was significantly warmer than average. Altus was 4 degrees above average. Weatherford was 6 degrees above average.
Checking on the National Weather Service’s Climate Prediction Center Outlooks there is also a pattern similar to 2016. The outlook maps for September 2-15, 2017 show an increased chance of below average temperatures. The ‘EC’ equal chance of precipitation for cotton areas means no rainfall trend indicated.
Equal chances means the probability of being above average, near average or below average are all the same. That means there is no trend indicated by the outlook for that time period.
For the entire month of September, the outlook is still close to ‘EC’ equal chance prediction. The small blue circle is barely above a 33.3% probability of below average temperatures. That same low probability is true for precipitation as well. Note where the probability is 40% or more for above average precipitation in southern Illinois, Indiana, and western Ohio.
The Three-month Outlook for September, October, and November 2017, indicates a slight increase in the probability for above average temperatures and above average precipitation.

These outlooks for 2017 follow the pattern of Fall 2016, so while the cotton crop is slightly behind in heat units, it may be above average October temperatures that pushes this year’s crop to a great harvest just like in October 2016.