Thankfully, here in August we’ve had a summer heat reprieve. While we’re a little cooler, Oklahoma’s plants are still pulling a lot of water out of the soil each day. And for many Oklahoma locations soils are on the dry side. That can put a strain on unirrigated summer crops as they head to maturity.
The Oklahoma Mesonet has soil moisture sensors at 2, 4, 10, and 24-inch depths. Soil moisture measurements from these sensors are reported as Fractional Water Index and Plant Available Water. Fractional Water Index is a point measurement from the depth the sensor is placed. Plant Available Water is a combination of sensors turned into the inches of water plants can take-up from the soil column.
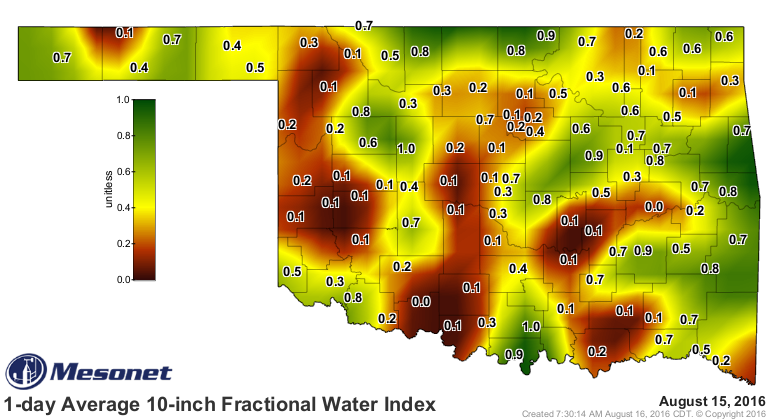
The Fractional Water Index for August 15, 2016 at the 10-inch depth had a lot of variation across the state. The Fractional Water Index goes from zero, when a sensor is dry, to one, when it is saturated. Dry areas are colored brown with Fractional Water Index values at and below 0.4. Areas with moisture are green with Fractional Water Index values at and above 0.6.
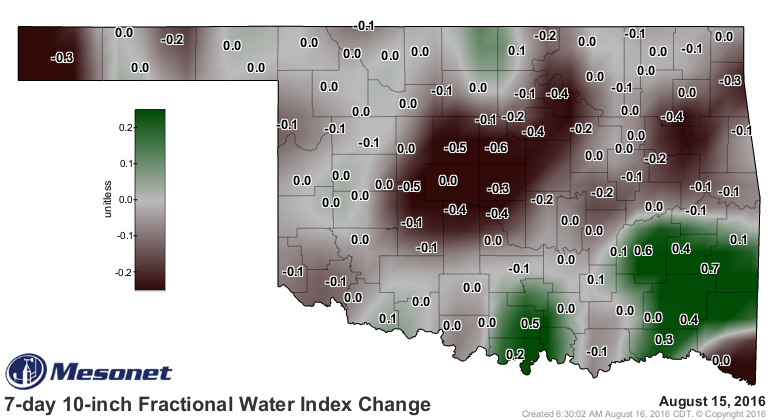
One way to get a good feel for how much water our plants are pulling out of the soil is the 7-day 10-inch Fractional Water Index Change map. Places that have seen an increase in soil moisture are positive values and colored green. On the map from August 15, 2016, Talihina jumped 0.7, going from 0.1 on August 8th to 0.8 on August 15th. The reverse was at Guthrie. It dropped -0.6 over 7 days, going from 0.7 to 0.1. The brown-purple shades denote losses in soil moisture.
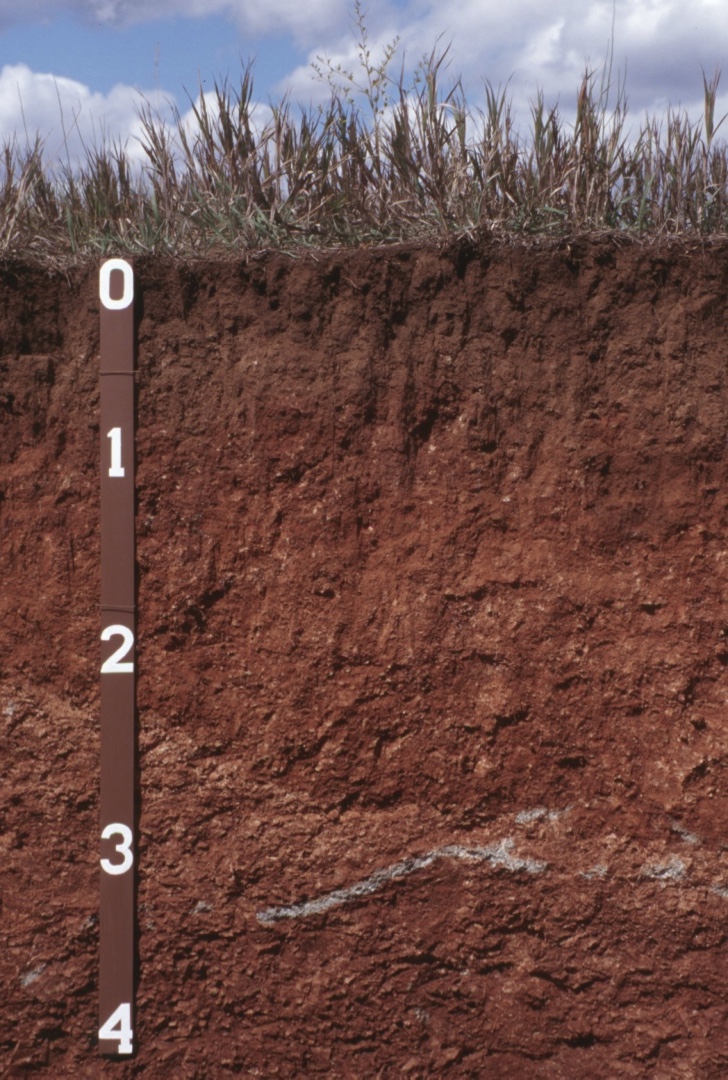
All Oklahoma Mesonet soil moisture sensors are under vegetation that is a combination of summer growing grasses and broadleaf rangeland plants. This is a summer picture from 2015 at the Guthrie Mesonet Site.

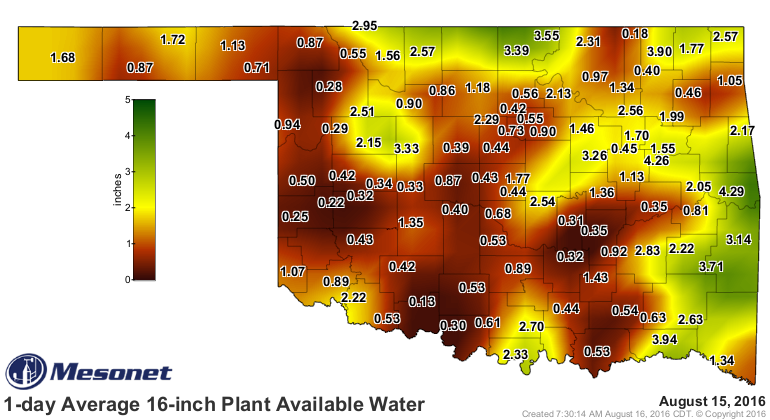
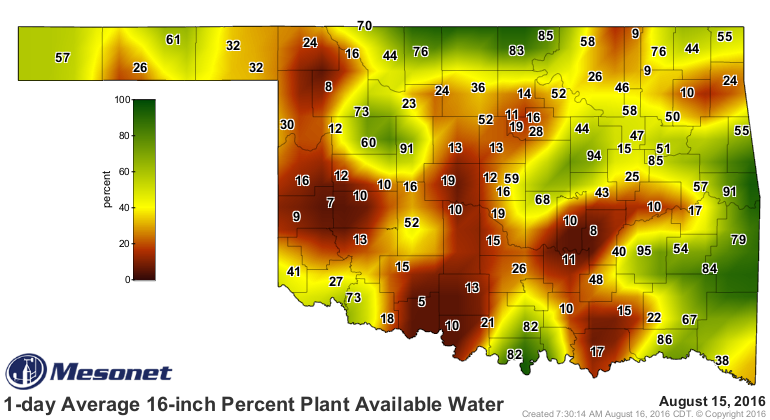
Plant Available Water is reported as inches of water from the surface to 4 inches, surface to 16 inches, and the surface to 32 inches. Plant Available Water is the water in the soil that plants use for growth and crop production between rains. On a map of Plant Available Water from the surface down to 16 inches, those locations with two or more inches of plant available water have enough water for the next 6-10 days. On the dry side are locations with less than an inch of Plant Available Water down to 16 inches. The very dry are locations below a half inch.
The 16-inch Percent Plant Available Water map let’s us know how much water is stored in the “soil tank” and how much water the soil could take in. Bristow at 94% could only take in 6% more water. Walters at 5% is extremely dry, it could take up lots of rain, before runoff begins.
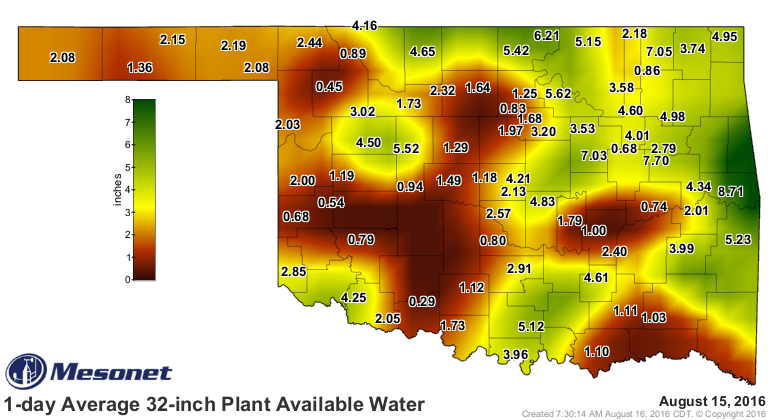
The Plant Available Water map from the surface down to 32 inches shows how much water is available from the full root zone for most plants. On our August 15, 2016 map, some areas that are dry in the top sixteen inches have water at the deeper depths. Cheyenne had 0.50 inches in the top 16 inches, but 2.00 inches in the top 32 inches. Norman had 0.68 it the top 16 inches and 2.57 inches of water from the surface down to 32 inches. Copan was at 0.18 and 2.18 inches. Plants with deeper roots can draw from deeper depths during dry stretches.
With Fractional Water Index you can explore soil moisture at 2, 4, 10 and 24-inch depths. Plant Available Water let’s you know how many inches of water are available. Those inches of water can help you decide if plants can make it to the next forecasted rain or they need water from an irrigation.