Oklahoma has been treated to above average rainfall this April. A Mesonet Rainfall Map for last two weeks of April, shows how that rain fell across Oklahoma from April 15th to April 29th. Cheyenne had the highest rainfall, 8.85 inches. The lowest rainfall location was Kenton with 1.10 inches of rain. Map numbers are rainfall amounts collected at Oklahoma Mesonet sites.

Background colors on the maps are radar rainfall estimates from the National Weather Service’s Arkansas-Red River Forecast Center in Tulsa. The lightest green color shows areas that received 1.0 to 1.5 inches of rain. Estimated rain amounts increase as the shades of green get darker. Areas with the darkest shade of green received between 3 and 4 inches of rain. Yellow marks areas that had over 4 inches. Bright orange designates spots with over 6 inches. Red areas were estimated to have 8 or more inches of rain.
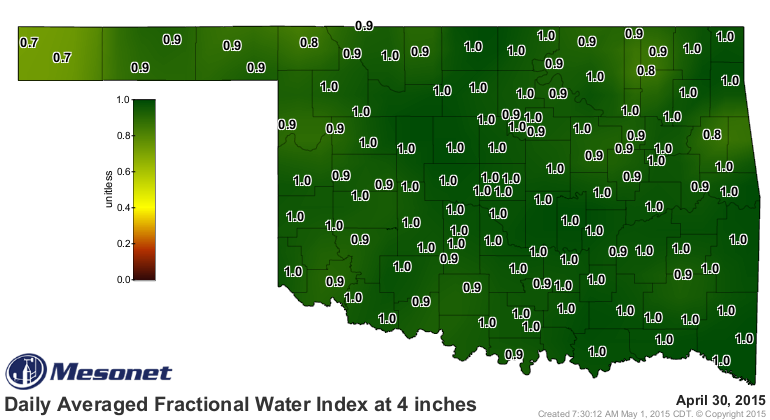
What is so significant about our recent, heavy rains is that they have replenished deeper soil moisture in areas that have been dry all the way back to 2010. Soil moisture maps at the end of April 2015 show more green than they have for a long time. For Fractional Water Index, dark green is for areas with high soil moisture, a value of 1.0. The driest soils have a fractional water index value of 0.0 and dark brown coloring.
Here is a Fractional Water Index Map of soil moisture at the 4-inch (10 centimeter) depth. 116 of Mesonet’s 120 stations are either 0.9 or 1.0. Kenton and Boise City were at 0.7. Buffalo and, far away, Talala had 0.8 fractional water index values.
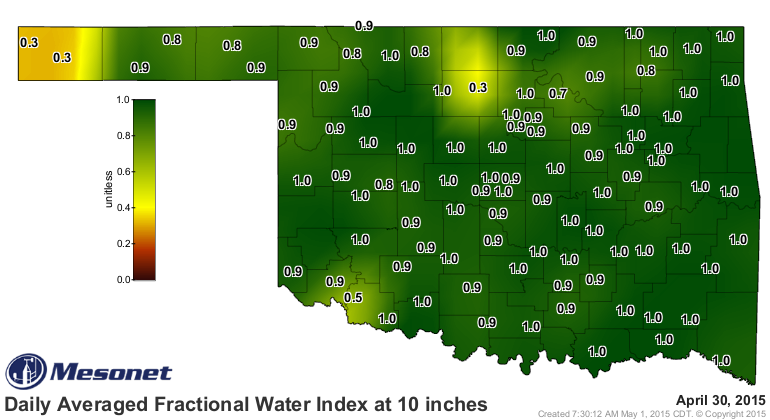
Dropping down to the 10-inch (25 centimeters) depth, we have only four locations on the dry side. Kenton, Boise City, and Brekenridge at 0.3 and Tipton at 0.5 fractional water index.
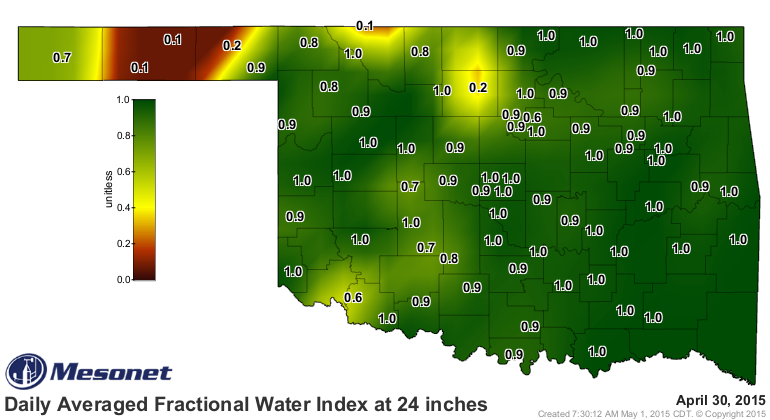
The Mesonet’s deepest soil moisture sensor at 2 feet (60 centimeters) shows how extensive the deeper soil moisture is in the state. Even in the southwest, there are a lot of locations at 0.9 or 1.0 fractional water index. At the 2-foot depth the dry soil locations are Goodwell, Hooker, and Mays Ranch at 0.1, Breckenridge at 0.2, and Tipton at 0.6. There are fewer Mesonet soil moisture sensors at 2 feet, which is why this map has less numbers on it.
We can see how fractional water index at all three depths changed over time on a Soil Moisture Graph for a single site. This graph for Goodwell in the Panhandle shows how a 0.67 inch rain on March 19, 2015 increased soil moisture at 2 inches (5 cm, red line) and 10 inches (25 cm, gold line). Following that rain, soil moisture decreased at both depths until 1.43 inches of rain was collected on April 27th. Even that rain wasn’t enough to soak down to 24 inches (60 cm, green line) at Goodwell. The 24-inch sensor hovered at a very dry 0.1 fractional water index.
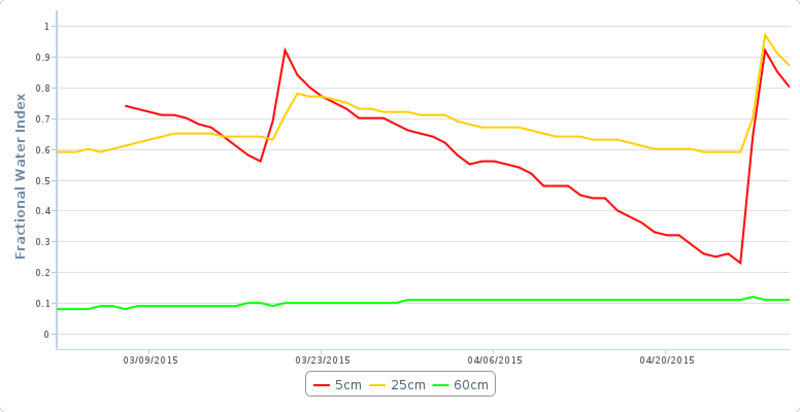
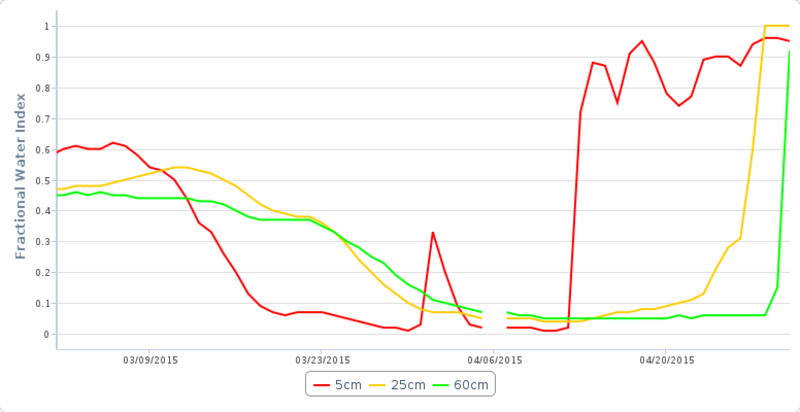
Now take a look at Kingfisher. Back in early March all of the soil depths came in between 0.4 and 0.6 fractional water index value. The 2-inch depth (5 cm, red line) dropped the fastest until a light rain of 0.41 inches on March 31, 2015. That rain was not enough to add moisture at the 10-inch (25 cm, gold line) and 24-inch (60 cm, green line) depths. Enough rain fell over scattered days on and after April 11th to push the 2-inch depth up to 0.9 and start a slow climb in fractional water index value at 10 inches. A rain of close to 2 inches on April 27th added enough moisture to wet the soil down to 24 inches (60 cm, green line).
April rains have been an answer to many Oklahomans’ prayers. These rains have filled soil profiles, filled river channels, and started the process of refilling Oklahoma’s low lakes.